OBIEE - Running Sum (RSum)
About
Running Sum is a display function.
This function calculates a running sum based on records encountered so far.
The “By” statement resets its values for each group.
Articles Related
Example
SELECT
  QUARTER,
  MONTH,
  revenue,
  RSUM(revenue)            AS RUNNING_SUM,
  RSUM(revenue BY QUARTER) AS RUNNING_SUM_BY_QUARTER
FROM
  sales_subject_area
Result:
QUARTER   MONTH    REVENUE    RUNNING_SUM   RUNNING_SUM_BY_QUARTER
1         JAN      100.00     100.00        100.00
1         FEB      200.00     300.00        300.00
1         MAR      100.00     400.00        400.00
2         APRIL    100.00     500.00        100.00
2         MAY      300.00     800.00        400.00
2         JUNE     400.00     1200.00       800.00
3         JULY     500.00     1700.00       500.00
3         AUG      500.00     2200.00       1000.00
3         SEPT     500.00     2700.00       1500.00
4         OCT      300.00     3000.00       300.00
4         NOV      200.00     3200.00       500.00
4         DEC      100.00     3300.00       600.00
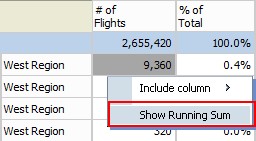
How to
Show a running sum in a graph
When your data have the same grain than the graph, you will get no problem. For instance, if you ask a week graph and that your data have only one line per week.
If your data have more than one line per week, you need to get the amount of the last line.
Unfortunately, OBIEE doesn't give the possibilitiy to set a Last aggregate rule for your column.
The following solution:
- calculates the first line per Week
- shows only the total amount by week of the first line
- and then calculates the Running Sum of the result.
RSUM
(
  CASE
  WHEN RCOUNT("Date"."Year Week" BY "Date"."Year Week") = 1 THEN
    SUM("Fact"."Amount" BY "Date"."Year Week")
  END
)
Requisites:
- The column aggregation rule rule must then be set to Max or Min.
- The sort order of the analytics must be set on each column of the analytics that forms the unique key. Ie for this example: The Week and others columns that permits to select the rows uniquely.
User Interface
Pivot View

User Interaction