About
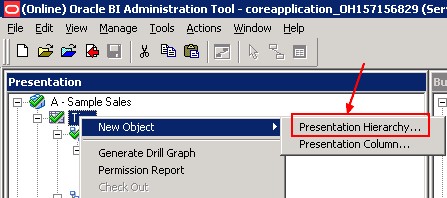
With presentation hierarchies, roll-up information is displayed in the Oracle BI Answers navigation pane, providing users with important contextual information.

Holds data values that are organized using both named levels and parent-child relationships. This column is displayed using a tree-like structure. Individual members are shown in an outline manner. Hierarchies allow you to drill deeper into the data, to view more detailed information.
Most importantly, users can create hierarchy-based queries using these objects.
Presentation hierarchies expose analytic functionality such as:
- member selection Filtering on Hierarchical columns is done through Selection Steps
,
- custom member groups,
- and asymmetric queries.
As with other Presentation layer objects, you can also:
- provide localization information
- and apply fine-grained access control to presentation hierarchies and levels.
When you sort items in a hierarchical column, you always sort within the parent. That is, children are never sorted outside of their parent. The children are displayed below the parent in the proper sort order; the parent is not sorted within its children.
The Offices Total parent is always displayed above its children:

Articles Related
Note
The Drill To Levels and Drill From Levels tabs are reserved for a future release and are not currently used. An additional option called Generate Drill Graph, available as a right-click option for any Presentation layer object, is also reserved for a future release.