Table of Contents
Data Visualization - Binary Outcome (0|1) (Good|Bad)
Example
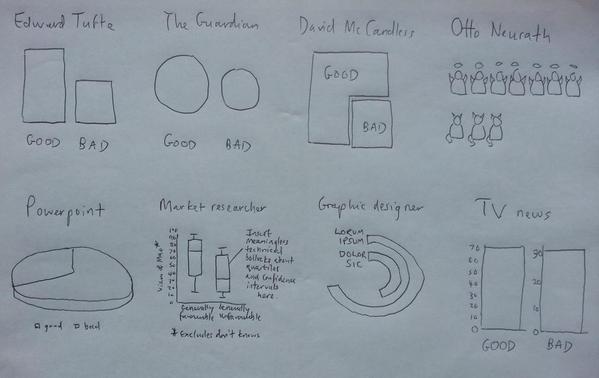
Mao was '70% good, 30% bad' according to the Chinese government. But how to visualise it…?