Data Visualization - Stream graph
Example
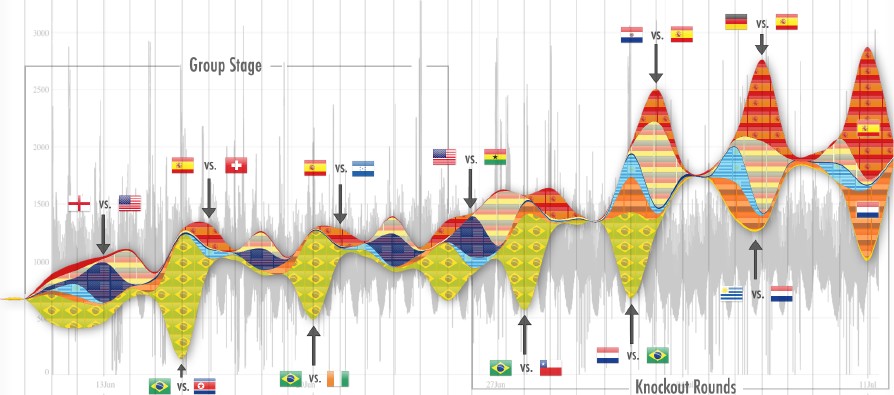
Twitter buzz during the 2010 FIFA World Cup.
- Background (in grey): time series of tweets per second.
- Foreground: a streamgraph of tweet volume based on hashtags, showing only the four teams that reached the semi-finals: Spain (#esp), Netherlands (#ned), Germany (#ger) and Uruguay (#uru) and the two teams with most activity during the tournament: United States (#usa) and Brazil (#bra).
From this visualization we clearly get a sense of the “ebb and flow” of the global conversation.
The graph was generated with streamgraph.js and post-processed with Photoshop to generate the final image (adding the labels, flags, etc.).