JVM - Memory (The Heap)
About
The JVM memory consists of the following segments:
- Heap Memory, which is the storage for Java objects
- Non-Heap Memory, which is used by Java to store loaded classes and other meta-data
- JVM code itself, JVM internal structures, loaded profiler agent code and data, etc.
Example
This example shows you how to set the memory parameters:
- start memory (xms)
- max memory (xms and maxpermsize )
java -Xms256m -Xmx2048m -XX:MaxPermSize=512m -jar myJar.jar
Others:
-Xms256m -Xmx2048m -XX:MaxPermSize=512m
-Xms128m -Xmx1024m -XX:MaxPermSize=256m
-Xms64m  -Xmx512m  -XX:MaxPermSize=128m
Property
JVM_ARGS
The environment variable JVM_ARGS is used to override JVM settings.
For example:
set JVM_ARGS="-Xms1024m -Xmx1024m -Dpropname=propvalue"
Property Name
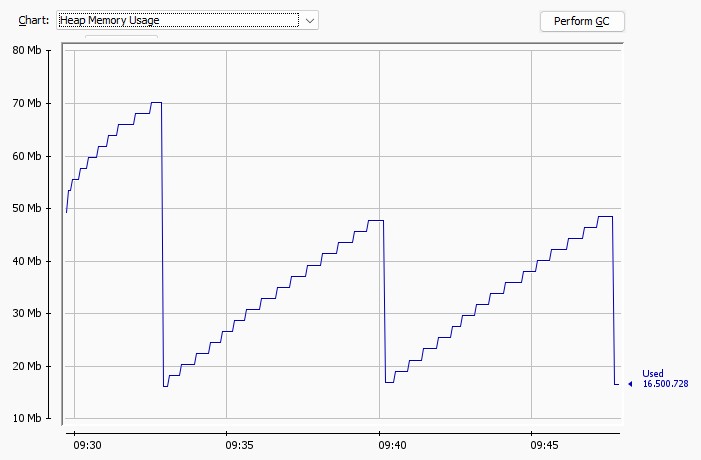
Heap
The heap memory is used to store Java Object.
The heap size may be configured with the following VM options when starting the JVM
-Xms<size> - to set the minimal/starting Java heap size
-Xmx<size> - to set the maximum Java heap size
If the application asks more than the maximum the JVM will throw the following exception: java.lang.OutOfMemoryError : Java Heap space.
The heap is managed by the garbage collector policy.
Native/Direct Memory
-XX:MaxDirectMemorySize
Native memory is used when you make a call to C/C++ code or the operating system (nio,…)
Permanent generation
This space has been removed in version 8 and replaced by MetaSpace. https://openjdk.org/jeps/122
The permanent space is where the class metadata is stored.
-XX:PermSize
-XX:MaxPermSize (Maximum size of the permanent generation)
Methods
Runtime
Jmx
With Jmx
MemoryMXBean memBean = ManagementFactory.getMemoryMXBean();
MemoryUsage heapMemoryUsage = memBean.getHeapMemoryUsage();

heapMemoryUsage.getMax(); // -Xmx flag
heapMemoryUsage.getInit(); // -Xms flag
heapMemoryUsage.getCommitted(); // given memory to JVM by OS
heapMemoryUsage.getUsed(); // used now by your heap
Monitoring
Memory Analyzer (MAT)
The Eclipse Memory Analyzer is a fast and feature-rich Java heap analyzer that helps you find memory leaks and reduce memory consumption.
Use the Memory Analyzer to analyze productive heap dumps with hundreds of millions of objects, quickly calculate the retained sizes of objects, see who is preventing the Garbage Collector from collecting objects, run a report to automatically extract leak suspects.
JMX client
You can use a Jmx client such as JConsole to monitor the memory.