Linux - (Hardware|Resource) Performance Monitoring Counters (Memory, Disk, CPU)
About
This page is about the management operating system metrics in the Linux System.
Collect
All command line tools are collector that collects and sends the metrics.
They may send them:
- into the console graphically
- or to a metrics server
For instance:
- for processes, the metrics are collected via the the proc file system. For instance, the /proc/swaps and /proc/meminfo files contain information about memory usage on your system.
Utilities
Command Line
This section is about command line utility that sends the metrics by default to the terminal.
- See Sysstat package
- See perf package
- ifstat(1), iftop(8), iostat(1), mpstat(1), netstat(1), nfsstat(1), nstat, vmstat(1), xosview(1)
ps -ef|grep <process>
- Linux - Top Command for the CPU
- iotop for the IO
- shared memory monitoring using the ipcs -m command.
- ps - processes data from multiple systems and treat it as a single data stream
- glance
Collector
This section is about collector that sends the metrics to a backend server
- Collectl to capture resource utilization metrics.
- collectl and colmux: colmux is a collectl multiplexor, which allows one to collect
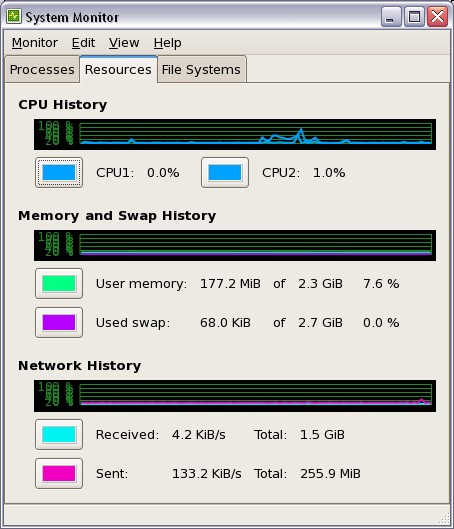
Gui - The system monitor of the Gnome Desktop
To start it:
- with the desktop GUI, System menu > Choose Administration > System Monitor option.
- at the shell prompt, type the following command :
gnome-system-monitor