About
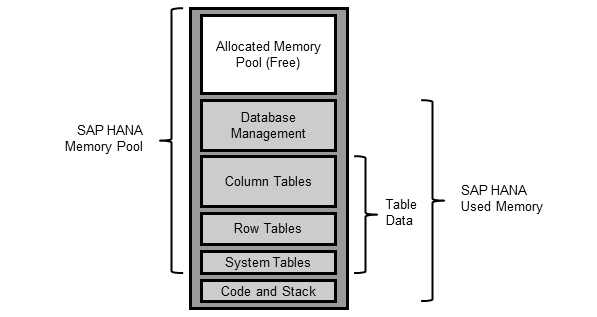
The total amount of memory used by SAP HANA is referred to as used memory.
At any given point, only parts of the memory pool are really in use. SAP refers to the total amount of memory actually in use as Used memory.
This is the most precise indicator of the amount of memory that SAP HANA uses.
It includes:
- program code and stack,
- all data
- system tables,
- the memory required for temporary computations.
Articles Related
Composition
where:
- The code and program stack size are about 6 GB (almost all of used memory is used for table storage, computations, and database management)
Used Memory
SQL
Instant
SELECT (
       (
         CODE_SIZE
         + SHARED_MEMORY_ALLOCATED_SIZE
         + HEAP_MEMORY_USED_SIZE
         ) / 1024 / 1024) AS "USED MEMORY"
FROM M_SERVICE_MEMORY
The overall allocated shared memory SHARED_MEMORY_ALLOCATED_SIZE is used for the calculation and not the value of SHARED_MEMORY_USED_SIZE. The reason for this is that the a shared memory segment can only be completely attached to the address space of the process and not just the used part.
- Single Summary by Host
select HOST, round(INSTANCE_TOTAL_MEMORY_USED_SIZE/1024/1024/1024, 2) as "Used Memory GB" from M_HOST_RESOURCE_UTILIZATION
- The indexserver holds all the data tables and temporary results, and therefore dominates the SAP HANA Used Memory. amount of indexserver Used Memory:
select HOST, round(TOTAL_MEMORY_USED_SIZE/1024/1024/1024, 2) as "Used Memory GB" from M_SERVICE_MEMORY where SERVICE_NAME = 'indexserver'
Over time
Used Memory over time to understand peak loads.
A snapshot copy of Used Memory is periodically saved in:
- the HOST_RESOURCE_UTILIZATION_STATISTICS system table,
- in the HOST_SERVICE_MEMORY (to examine memory usage by service)
- peak amount of Used Memory since the server was restarted:
select top 1 HOST, SERVER_TIMESTAMP, round(INSTANCE_TOTAL_MEMORY_USED_SIZE/1024/1024/1024, 2) as "Peak Used GB" from _SYS_STATISTICS.HOST_RESOURCE_UTILIZATION_STATISTICS order by "Peak Used GB" desc
- value of Used Memory at 7:00 AM during each of the last 30 days:
select top 30 HOST, SERVER_TIMESTAMP, round(INSTANCE_TOTAL_MEMORY_USED_SIZE/1024/1024/1024, 2) as "Used Memory GB" from _SYS_STATISTICS.HOST_RESOURCE_UTILIZATION_STATISTICS where hour(SERVER_TIMESTAMP) = 7 and minute(SERVER_TIMESTAMP) = 0 order by SERVER_TIMESTAMP desc
Studio
Administration > Overview:


