
About
Bootstrap is a powerful resampling method for assessing uncertainty in estimates and is particularly good for getting their:
- and confidence limits.
Why is the bootstrap useful? The bootstrap allows you to simulate repeated statistical experiments. Statistics computed from bootstrap samples are typically unbiased estimators.
Brad Effron has invented the bootstraps and proposed it in his 1980 paper. This methods became one of the most important techniques in statistics in the last 30 years.
It's a convenient way to do certain kinds of Bayesian calculations. And moreover, not just to do them, but to understand why Bayesian calculations are really more closely related to frequentist work then is obvious.
Articles Related
Origin of its name
The use of the term bootstrap derives from the phrase to pull oneself up by one's bootstraps, widely thought to be based on this quote:
The Baron had fallen to the bottom of a deep lake. Just when it looked like all was lost, he thought to pick himself up by his own bootstraps.
The idea
It's not the same as the term bootstrap that one uses in computer science to boot a computer. But it's the same idea. You're trying to pull yourself up from what you've got.
In a data case, you're going to use the data sample itself to try to get more information about an estimator.
True Sampling Distribution
This histogram on the left shows the 1,000 values over 1,000 samples from the population.
Each one is a value of the estimator, and they average around 0.6. It's called the sampling distribution of that estimator.
From this histogram, we can get the standard deviation of the estimates.
When you're able to recompute the estimator many, many times from your samples, the standard deviation is called the standard error. (Ie The standard error of an estimator is the standard deviation in that sampling distribution.)
- We don't actually have the ability to sample from the population.
- We don't have access to the population.
- All we have is a sample.
If we had access to the population, we actually wouldn't need statistics at all, for the most part.
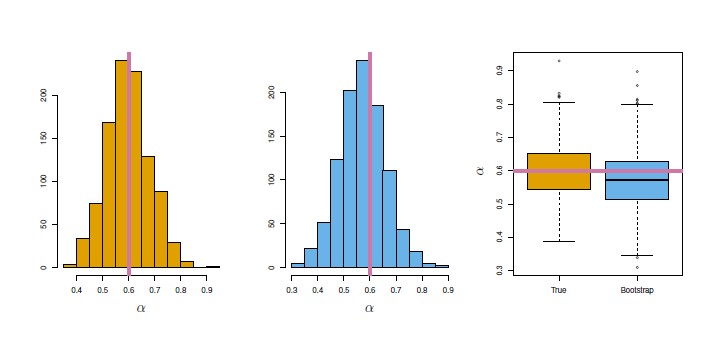
- Left: A sampling distribution of the estimates of alpha obtained by generating 1,000 simulated data sets from the true population.
- Center: A sampling distribution of the estimates of the estimator alpha obtained from 1,000 bootstrap samples from a single data set. See below
- Right: The estimates of displayed in the left and center panels are shown as boxplots. In each panel, the pink line indicates the true value of alpha .
BootStrap
We can't produce the sampling distribution because we don't have the ability to get/generate more data. But the bootstrap is going to try. It's going to mimic of obtaining new sample by sampling not from the population, but from the sample itself. With this method, we can then estimate the variability of our estimate without generating additional samples.
Instead of obtaining independent data sets from the population, we're going to sample from the data itself with replacement as bootstrap sampling is sampling with replacement.
A superscript star indicates a bootstrap sample as distinct from a training sample, which has no superscript.
Standard bootstrap
If you had N balls (your original sample) into a bag, you will follow the below procedure in order to create a bootstrap sample:
- Put our hand in the bag
- Pull out one ball (randomly)
- Put the ball back in the bag.
- Go back to the first steps N-1 times.
That's sampling with replacement. Each observation can appear more than once, or maybe not at all, depending on what happens as we draw the samples. At the end of the process, the bootstrap sample will got the same size as the original sample and will be use to obtain an estimate.
Block bootstrap
Each time, we get a bootstrap sample of size n, we get a bootstrap quantity alpha hat star. The standard error of alpha hat star is the bootstrap estimate of standard error of alpha hat.
If we want to predict for example the stock price for a given day from the previous day, the data are not independent because there's correlation in the time series. We expect the stock price for a given day to be correlated with the stock price from the previous day. And that's a significant problem.
As a matter of fact, if we're trying to predict the stock price from a given day from the previous day, we hope there's correlation. If they were independent, the prediction wouldn't be very useful. But this correlation creates a problem for the bootstrap.
In applying the bootstrap to time series data it is essential that the (dependencies|correlation) be properly accounted for. The most common way of doing this is to sample the observations in blocks rather than individually.
Block bootstraps divides the data up into blocks assuming that each block is independent.
The sampling units will not more be on the lowest detail (ie by individual observations) but an entire block of the data that are uncorrelated. This block will then be used as a basis element for the replacement phase.
For instance, a block of size three in a times series could be use under the assumption that beyond a time lag of three days, things are somewhat uncorrelated. As within a block, we expect correlation, we keep the blocks intact and sample them as units. That's called the block bootstrap.
we can't use the standard bootstrap for some time series data because :
- the data points in most time series aren't i.i.d. independent and identically distributed
- the standard bootstrap doesn't accurately mimic the real-world data-generating mechanism
Accuracy Metrics
Standard Error
<MATH> SE_B(\hat{\alpha}) = \sqrt{\frac{1}{B-1}\sum^B_{i=1}(\hat{\alpha}^{*i}-\bar{\hat{\alpha}})^2 } </MATH>
where:
- <math>\alpha</math> is an estimator
- B is the number of bootstrap samples
- <math>\hat{\alpha}^{*i}</math> is the estimator of the bootstrap sample i
Confidence interval
Suppose I want a 0.9 confidence interval so that it contains a true value with probability 90%. It makes sense to grab the fifth and 95th percent quantiles.
In other words, find the 5% point of this histogram and the 95% point of that histogram.
Interpretation: the confidence interval means that if we were to repeat this experiment from the population many times, it would be the case that the confidence interval that we obtain would contain the true value of our estimate 90% of the time. That's what a 90% confidence interval is.
There's actually an entire field in statistics to do with confidence intervals in the bootstrap and many ways to calculate it. This bootstrap percentile interval is the simplest way of constructing a confidence interval from the bootstrap.
Other way: all possible bootstrap samples
One way of carrying out the bootstrap is to average equally over all possible bootstrap samples from the original data set (two bootstrap data sets are different if they have the same data points but in different order). Unlike the usual implementation of the bootstrap, this method has the advantage of not introducing extra noise due to resampling randomly.
Example with a data set of 3 observations (1,2,3) gives a total of 27 bootstrap data sets <math>n^n</math> and if you plot the average, you get a normal distribution as stated by the central limit theorem.
| Number Series | Average | ||
|---|---|---|---|
| 1 | 2 | 3 | 2.00 |
| 3 | 1 | 2 | 2.00 |
| 2 | 3 | 1 | 2.00 |
| 1 | 3 | 2 | 2.00 |
| 3 | 2 | 1 | 2.00 |
| 2 | 1 | 3 | 2.00 |
| Same numbers | |||
| 1 | 1 | 1 | 1.00 |
| 2 | 2 | 2 | 2.00 |
| 3 | 3 | 3 | 3.00 |
| Double 1 combinations | |||
| 1 | 1 | 2 | 1.33 |
| 1 | 1 | 3 | 1.67 |
| 1 | 2 | 1 | 1.33 |
| 1 | 3 | 1 | 1.67 |
| 2 | 1 | 1 | 1.33 |
| 3 | 1 | 1 | 1.67 |
| Double 2 combinations | |||
| 2 | 2 | 1 | 1.67 |
| 2 | 2 | 3 | 2.33 |
| 1 | 2 | 2 | 1.67 |
| 3 | 2 | 2 | 2.33 |
| 2 | 3 | 2 | 2.33 |
| 2 | 1 | 2 | 1.67 |
| Double 3 combinations | |||
| 3 | 3 | 1 | 2.33 |
| 3 | 3 | 2 | 2.67 |
| 1 | 3 | 3 | 2.33 |
| 2 | 3 | 3 | 2.67 |
| 3 | 1 | 3 | 2.33 |
| 3 | 2 | 3 | 2.67 |
Bootstrap Vs cross-validation
A crucial part of cross-validation is that there's no overlap between the training set and the validation set. In other words, the observations in one do not appear in the other. And that's important, because we're trying to get an idea of test set error on new data. There's a a clean separation, between training and validation.
Each bootstrap sample gets to play the role of the training set to fit. And then, I'm going to predict my original training sample as my validation set.
This method then has a big problem that is there's an overlap between the bootstrap data sets and the original data set. In particular, about 2/3 of the original data points appear in each bootstrap sample. That's 2/3 of the points in each training set have already been seen by the model because they're in the bootstrap data set. This is therefore not a good way of estimating prediction error.
You can fix it by, when you train on the bootstrap sample and then predict the training sample, just recording the predictions for the points that did not occur in the bootstrap sample– in other words, the points that are actually novel points. But this gets complicated and in the end, it's really not worth it when comparing to the results of cross-validation. keep it simple