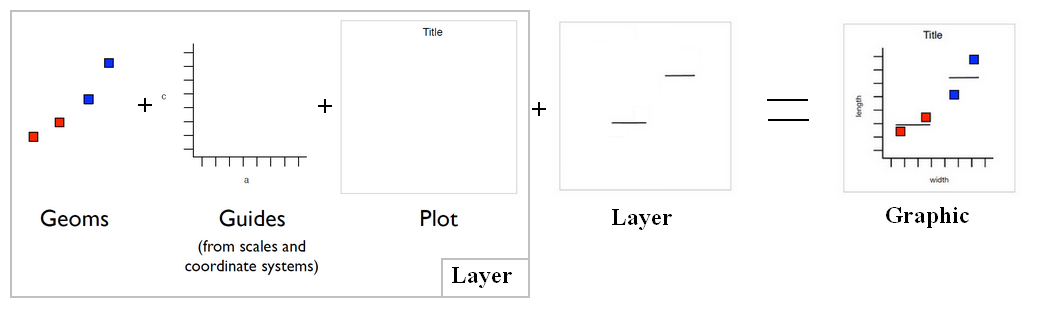
Ggplot - Bars, rectangles with bases on x-axis (Geom_bar)
A bar geom makes the height of the bar proportional to: the number of cases in each group (default) or the sum of a column (using the weight aesthetic) The geom_bar layer is used to produce 1d area...