Statistics - (Discretizing|binning) (bin)
About
Discretization is the process of transforming numeric variables into nominal variables called bin.
The created variables are nominal but are ordered (which is a concept that you will not find in true nominal variable) and algorithms can exploit this ordering information.
The inverse function is Statistics - Dummy (Coding|Variable) - One-hot-encoding (OHE).
Characteristics / Problem Definition
- Split-point is a number and there are infinitely many numbers.
- finding a set of cut points to partition the range into a small number of intervals
- minimizing the number of intervals without significant loss of information
Why?
- Discretization can be useful when creating probability mass functions – formally, in density estimation.
- Continuous explanatory attributes are not so easy to handle because they can take so many different values that is difficult to make a direct estimation of frequencies.
- A large number of Machine Learning and statistical techniques can only be applied to data sets composed entirely of nominal variables.
Type
Unsupervised
Unsupervised Discretization does not take into account the class.
There is two basic methods where the is discretized into K bin of:
- equal width (lengths, range value)
- equal frequencies (% of the total data, same number of observations per bin)
Equal-frequency binning is sensitive to the data distribution, which will probably make it perform better.
Unsupervised Discretization is usually performed prior to the learning process and it can be broken into tasks that must find.
- the number of discrete intervals.
- the boundaries of the intervals
- which method to use
They are experimental questions and there is no universally best method. It depends on the data.
Equal-width
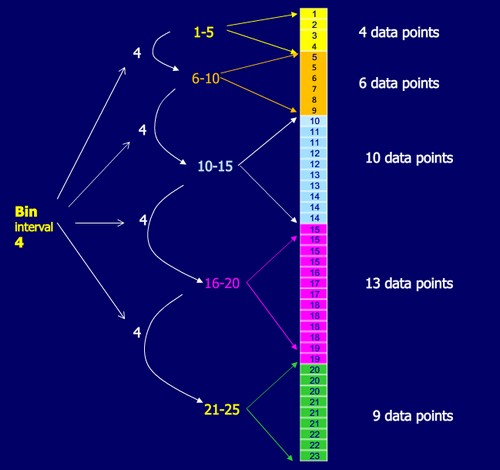
The range of the numeric attribute is chopped into a certain number of equal parts, or bins. Wherever a numeric value falls into a bin, we take the bin name as the discretized version of the numeric value. The number of data points between bins may vary.
Equal-frequency
The algorithm will try to make the number of data points in each bin equal. It will adjust the size to make the number of instances that fall into each bin approximately the same.

Bin with the same frequency are quantile.
Using the ordering relationship
There's an ordering relationship in a continuous variable. However, when we discretize it into different bins, we are losing this information.
Which can be a problem in a tree: Before discretization, if we add a test such as “is x<v?”, after discretization, to get the equivalent test, we would need to ask “is y=a?”, “is y=b?”, “is y=c?” and replicate the tree underneath each of these nodes. That's clearly inefficient and is likely to lead to bad results.
Instead of discretizing into five different values a to e, we can discretize into four different binary attributes, k-1 binary attributes. The first attribute here says whether the value v is in this range, and the second attribute, z2, says whether it's in this range, a or b. The third, z3, says whether it's in this range, a, b, or c. The fourth says whether it's in the first four ranges.
If in our tree we have a test “is x<v?”, then if x is less than v, then z1, z2, and z3 are true and z4 is false. So an equivalent test on the binary attributes is “is z3=true?”.
The binary attributes include information about the ordering of the original numeric attribute values.
Supervised (Highest gain)
Supervised discretization is about taking the class into account when making discretization decisions.
The most common way is to use an entropy heuristic. The heuristic will choose the split point with the smallest entropy, which corresponds to the largest information gain, and continue recursively until some stopping criterion is met.
You shouldn't use any information about the class values in the test set to help with the learning method, otherwise the model has already seen and captured the test set information.
In weka, see the classifier “FilteredClassifier” from “meta”. It's a “class for running an arbitrary classifier on data that has been passed through data modifications (in weka a filter). By using it, the test sets used within the cross-validation do not participate in choosing the discretization boundaries. The discretization operation is apply to the training set alone.
Discretization boundaries are determined in a more specific context but are based on a small subset of the overall information particularly lower down the tree, near the leaves.
For every internal node, the instances that reach it must be sorted separately for every numeric attribute
- and sorting has complexity O(n log n)
- but repeated sorting can be avoided with a better data structure
Performance
- The classifiers SMO and SimpleLogistic implement linear decision boundaries in instance space. Discretization (with makeBinary enabled) would probably improve performance, because it allows a more complex model, no longer linear in the decision space.
- IBk can implement arbitrary boundaries in instance space. pre-discretization will not change the Ibk performance significantly (Performance = high accuracy)
Bias
Binning data in bins of different size may introduce a bias.
The same data tells a different story depending on the level of detail you choose. Here's the same data about population growth in Europe (orange = growth, blue = decline) in five different units.