Essbase - User Requirement to determine the Dimension and Members
Identifying User Requirements
The analyze of the user requirement must determine the Essbase - Dimension and Essbase - Members. The number of members needed to describe a potential data point should determine the number of dimensions.
To ensure that the design meets user information requirements, you must view data as users view it. Users typically view data through spreadsheets, printed reports, or reports published on the Web.
Checklist
- How do users want to view and analyze data?
- What types of analysis do users require?
- If analyzing by time, which time periods are needed?
- If analyzing by geographical region, how do you define the regions? ( by sales territories? by regions, by geographical boundaries such as states and cities? )
- If analyzing by product line, should you review data for each product? Can you summarize data into product classes?
- What summary and detail levels of information do users need? How many levels does the data require? How does the data consolidate?
- Do users want to qualify their view of a dimension? The categories by which they qualify a dimension are candidates for attribute dimensions.
- How does your company use the data?
Example
Requirement to Dimension
A financial analyst, for example, may ask the following questions:
- What are sales for a particular month? How does this figure compare to sales in the same month over the last five years?
- By what percentage is profit margin increasing?
- How close are actual values to budgeted values?
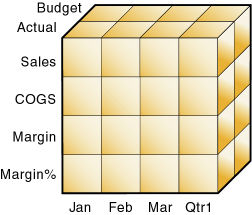
In other words, the analyst may want to examine information from three perspectives (as three Essbase - Standard dimensions):
- a time dimension, which comprises Jan, Feb, Mar, and the total for Qtr1—is displayed along the X-axis.
- a account dimension, which consists of accounting figures such as Sales, COGS, Margin, and Margin%, is displayed along the Y-axis.
- and scenario, a another dimension, which provides a different point of view, such as Budget for budget values and Actual for actual values, is displayed along the Z-axis.
Example Dimension-Member Structure
Sample Standard Dimensions
| Dimensions | Members | Child Members |
|---|---|---|
| Year | Qtr1 | Jan, Feb, Mar |
| Qtr2 | Apr, May, Jun | |
| Qtr3 | Jul, Aug, Sep | |
| Qtr4 | Oct, Nov, Dec | |
| Measures | Profit | Margin: Sales, COGS Total Expenses: Marketing, Payroll, Miscellaneous |
| Inventory | Opening Inventory, Additions, Ending Inventory | |
| Ratios | Margin %, Profit %, Profit per Ounce | |
| Product | Colas (100) | Cola (100‑10), Diet Cola (100‑20), Caffeine Free Cola (100‑30) |
| Root Beer (200) | Old Fashioned (200‑10), Diet Root Beer (200‑20), Sarsaparilla (200‑30), Birch Beer (200‑40) | |
| Cream Soda (300) | Dark Cream (300‑10), Vanilla Cream (300‑20), Diet Cream Soda (300‑30) | |
| Fruit Soda (400) | Grape (400‑10), Orange (400‑20), Strawberry (400‑30) | |
| Market | East | Connecticut, Florida, Massachusetts, New Hampshire, New York |
| West | California, Nevada, Oregon, Utah, Washington | |
| South | Louisiana, New Mexico, Oklahoma, Texas | |
| Central | Colorado, Illinois, Iowa, Missouri, Ohio, Wisconsin | |
| Scenario | Actual | |
| Budget | ||
| Variance | ||
| Variance % |
Sample Attribute Dimensions
Two Attribute Dimensions to enable product analysis based on size and packaging
| Dimensions | Members | Child Members |
|---|---|---|
| Ounces | Large | 64, 32, 20 |
| Small | 16, 12 | |
| Pkg Type | Bottle | |
| Can |