(Operating) System Metrics
About
This article is about the resources Metrics of an OS (Operating System)
Meaning that they will report on all physical server functional components (CPUs, disks, busses, …).
The primary metrics are:
- CPUs (sockets, cores, hardware threads, virtual CPUs)
- Memory (Utilization, capacity)
- Disk Usage (I/O, capacity)
In addition to network components:
- Network interfaces (Network IO)
- Controllers: storage, network cards
- Interconnects: CPUs, memory, I/O
OS
The OS documentation is the best place to find out how you can collect and or visualize the performance metrics
- Windows: Perfcounter - Windows.
Example
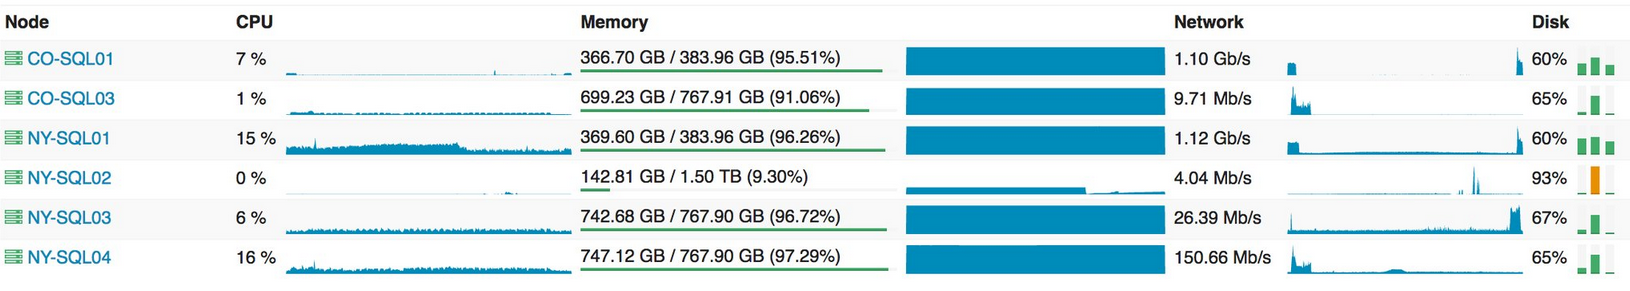
Key metrics to monitor
- Memory usage (available memory, process memory and swapping)
- Disk (Reads/writes per second, disk queue)
- Network (I/O Bytes, duplicate ACKs or errors)
Check both at the Operating System level and the Process level.
32-bit processes can use at most 2 GB of virtual memory on Windows (normal OS settings) and 4 GB on Unix. Check to be sure these limits are not being reached.
Process Level
Collect these counters for all processes:
- HOSTNAME\Process(ProcessName)\% Processor Time
- HOSTNAME\Process(ProcessName)\Handle Count
- HOSTNAME\Process(ProcessName)\ID Process
- HOSTNAME\Process(ProcessName)\IO Data Bytes/sec
- HOSTNAME\Process(ProcessName)\Page Faults/sec
- HOSTNAME\Process(ProcessName)\Page File Bytes
- HOSTNAME\Process(ProcessName)\Thread Count
- HOSTNAME\Process(ProcessName)\Virtual Bytes
- HOSTNAME\Process(ProcessName)\Working Set
(Machine|OS) Level
- HOSTNAME\Processor(_Total)\% Processor Time
- HOSTNAME\Memory\Available MBytes
- HOSTNAME\Memory\Pages/sec
- Interface(xxxx Gigabit Server Adapter _2)\Bytes Received/Sec
- Interface(xxxx Gigabit Server Adapter _2)\Bytes Sent/sec
- Interface(xxxx Gigabit Server Adapter _2)\Bytes Total/sec
- Interface(xxxx Gigabit Server Adapter _2)\Current Bandwidth
- HOSTNAME\PhysicalDisk(0 C:)\% Disk Time
- HOSTNAME\PhysicalDisk(0 C:)\Avg. Disk Queue Length
- HOSTNAME\PhysicalDisk(0 C:)\Disk Bytes/sec
Choose the perfcounter to monitor
Start by monitoring the activity of the following components in order:
- Network
The following table shows the minimum counters recommended for server monitoring. When examining specific resources, you should include other counters for the associated performance object.
| Component | Performance aspect being monitored | Counters to monitor |
|---|---|---|
| Disk | Usage | Physical Disk\Disk Reads/sec Physical Disk\Disk Writes/sec LogicalDisk\% Free Space Interpret the % Disk Time counter carefully. Because the _Total instance of this counter may not accurately reflect utilization on multiple-disk systems, it is important to use the % Idle Time counter as well. Note that these counters cannot display a value exceeding 100%. |
| Disk | Hindrances | Physical Disk\Avg. Disk Queue Length (all instances) |
| Memory | Usage | Memory\Available Bytes Memory\Cache Bytes |
| Memory | Hindrances | Memory\Pages/sec Memory\Page Reads/sec Memory\Transition Faults/sec Memory\Pool Paged Bytes Memory\Pool Nonpaged Bytes Although not specifically Memory object counters, the following are also useful for memory analysis: * Paging File\% Usage object (all instances) * Cache\Data Map Hits % Server\Pool Paged Bytes and Server\Pool Nonpaged Bytes |
| Network | Throughput | Protocol transmission counters (varies with networking protocol); for TCP/IP: * Network Interface\Bytes total/sec * Network Interface\ Packets/sec * Server\Bytes Total/sec or Server\Bytes Transmitted/sec and Server\Bytes Received/sec You may want to monitor other objects for network and server throughput as described in Monitoring network activity. |
| Processor | Usage | Processor\% Processor Time (all instances) |
| Processor | Hindrances | System\Processor Queue Length (all instances) Processor\ Interrupts/sec System\Context switches/sec |