Dimensional Data Operation - (Pivot|Transpose|Cross-tab|Matrix)
About
The pivot is an dimensional data operation where rows and columns are interchanged.
Pivot is also known as:
- Transpose in the linear algebra word
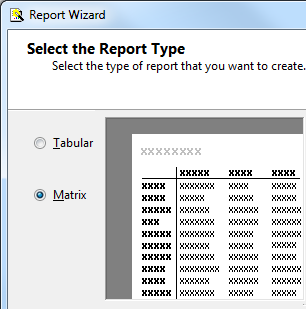
- Matrix in the Microsoft world
- Cross-tab
This operation is typically performed by the visualization tool.
Articles Related
Statistics
wiki/Cross tabulation (or crosstabs for short) is a statistical process that summarises categorical data to create a contingency table. Some entries may be weighted, unweighted tables are commonly known as pivot tables.
Analytics Client
SQL
select cust_id,
       max(decode(day,trunc(sysdate-0)),sales)) day1,
       max(decode(day,trunc(sysdate-1)),sales)) day2,
       .....
       max(decode(day,trunc(sysdate-6)),sales)) day7
  from fact,dim
 where <join>
   and day >= sysdate minus whatever....
  group by cust_id;
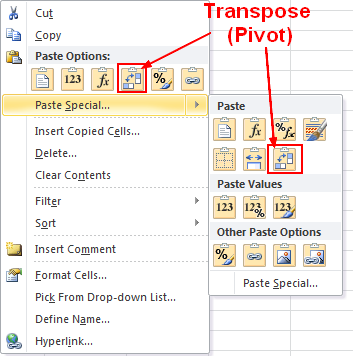
Excel
Copy > Paste Special > Transpose
Microsoft Report (SSRS)
Disadvantage as a storage structure
Disadvantage of this structure as a storage structure, if a pivot is used to represent different possible values of a column.
If you want:
- to add a category, you need to add a category column for each column
- to do an update on one of this fields, you end up with a list of “IF THEN ELSE”.
- to do an aggregation on one of this fields, you end up with a list of “UNION”.
- to add an audit function on it, you need to add an audit on each column
- to set a value that is dependent of others dimensions, you end up adding a lot of column.
- If you have 1 metrics column with 2 dimensions, you add 2 columns
- If you have 2 metrics column with 2 dimensions, you add 4 columns
- …
Furthermore, it's not a third normal form. Then if the data is sparse, you cannot save it in a parse form and you end ups using a lot of storage for nothing and can degrade seriously then the performance.