About
A percentile is a 100-quantile.
For instance:
- A child whose height is in the 70th percentile is taller than 70% of the children of their same age.
- A 40th percentile would be a value in which 40% of the numbers are less than that observation.
Articles Related
Example
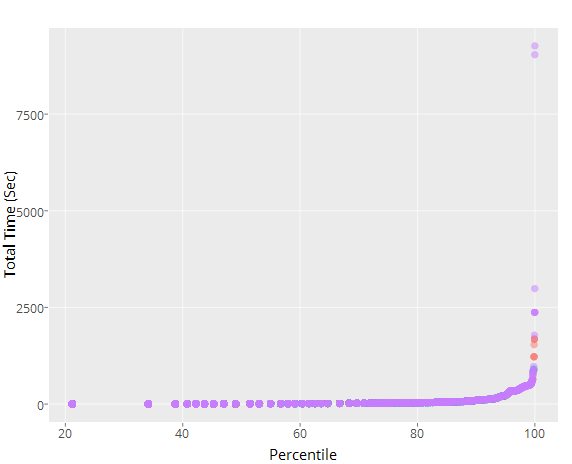
## Add the percentile to the data.frame
res_succes$percentile <- ecdf(res_succes$TOTAL_TIME_SEC)(res_succes$TOTAL_TIME_SEC)
## Plot it
ggplot(res_succes, aes(x=percentile*100, y=res_succes$TOTAL_TIME_SEC, colour = factor(res_succes$PRESENTATION_NAME))) +
           geom_jitter(alpha = 0.5)
         + labs(x="Percentile",y="Total Time (Sec)")
where:
- ecdf computes an empirical Cumulative Distribution Function. ecdf(X)(Y) is the value of the cumulative distribution of X at the points in Y.