Performance - (Latency|Response time|Running Time)

Scale Counter Graph

About

Latency is a performance metric also known as Response time.

Latency (Response Time) is the amount of time take a system to process a request (ie to first response) from the outside or not, remote or not,

In other words, how much time it takes between making a request and receiving the first data requested. That you can implement so: the time calculated just before sending the request to just after the first response has been received.

A request can be:

  • an UI action (such as pressing a button)
  • or a server API call

Network Protocol analysers (such as Wireshark) measure the time when bytes are actually sent/received over the interface.

See also: Algorithm - (Performance|Running Time|Fast)

Can we answer “What was the performance?” by “It took 15 seconds. Performance’s units, “inverse seconds”, can be awkward

Response Time Of System

Measurement

Latency measurement is done via a timer metrics

See also: CPU - (CPU|Processor) Time Counter

Requirement

Service level expectation in percentile:

  • 90% of responses should be below 0.5sec,
  • 99% should be below 2 seconds,
  • 99.9 should be better than 5 seconds.
  • And a >10 sec. response should never happen.

If you haven’t stated percentiles and a Max, you haven’t specified your requirements

User Perception

  • 100 ms: user perceives as instantaneous
  • 1s: is about the upper limit of human flow of though. User loses the feeling direct feedback
  • 10s: Upper limit of attention. Feedback is important and the chance of context switch is high.

Source: Response Times: The 3 Important Limits

page speed (Slow pages lose user)
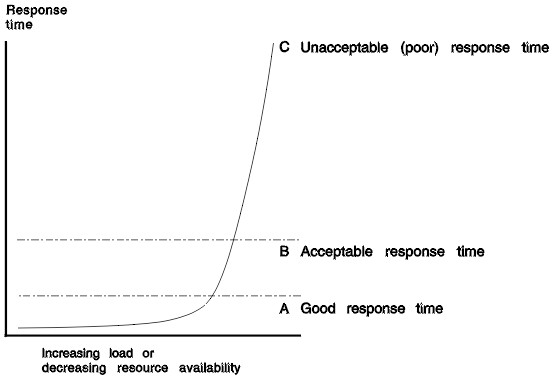
Page Load Time Latency Vs Bounce

Response Time

over load

Time response over load, for a system with a uniform response time. Without a lot of variance. Ie 99.7% of the request fall in 3 standards deviations.
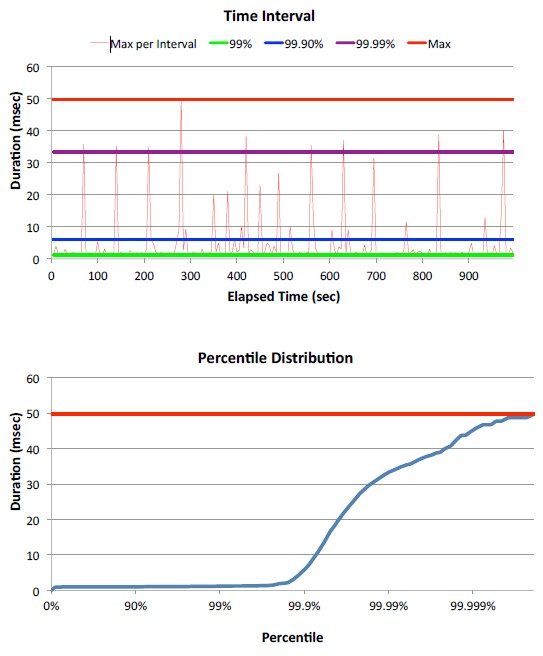
Response Time Over Load

percentile

Quantile - Percentile

Response Time Percentile

Storage

hdrhistogram - data structure to capture latency

See also: https://tideways.io/profiler/blog/developing-a-time-series-database-based-on-hdrhistogram

Documentation / Reference


Discover More
Card Puncher Data Processing
Data Integration - Synchronization

duplicate of of ? Ensure that all instances of a repository (database, file system, ...) contain the same data. Its not a trivial task when the data is volatile. Replication is the process of copying...
Data System Architecture
Data property - Data Latency

Data latency is a property of eventual consistency and describe how quickly two set of data will be consistent. This is a latency performance of the consistency of your data. In a DW/BI environment,...
Jmeter Sampler Result In A View Result Tree
JMeter - (Sampler Result | Sample | Listener (Output|Results|Data) File)

The results of a sample are showed by a listener in different ways: a tree, tables, graphs response data) All listeners write the same raw data to the output file when one is specified.-l flatest...
Mdm Sap
Master Data Management (MDM)

solutions are considered to hold the master for any given entity. In computing, master data management (MDM) comprises a set of processes and tools that consistently defines and manages the non-transactional_data...
Map Of Internet 1973
Network - Latency

Latency in Network protocol (ie TCP/UDP latency) TCP:
Map Of Internet 1973
Network - Latency Calculation (Transfer time)

Rule of thumb to calculate a transfer time of a 20 Gigabyte file over an IP connection with bandwidth that is less than Gigabit. Number of raw data in bits: GBtraffic “”“” When the raw...
Card Puncher Data Processing
Oracle Database - COMMIT (of a transaction)

in oracle A commit ends the current transaction and makes permanent all changes performed in the transaction. When a transaction commits, the following actions occur: A system change number...
Card Puncher Data Processing
Oracle Database - DB_FILE_MULTIBLOCK_READ_COUNT Parameter

This parameter determines how many database blocks are read in a single I/O (with a single operating system READ call) during a: full table scan or index fast full scan. SQL parallel execution is...
Scale Counter Graph
Performance

has two dimensions (two metrics): either the Time to do the task from start to finish (execution time, response time, latency) or the tasks per unit time (throughput, bandwidth) is a feature....
Scale Counter Graph
Performance - (Throughput|Bandwidth|Transfer rate|Frequency)

Throughput is a performance metric showing the amount of data flow a system can support, measured by Example: hits per second, pages per second, and megabits of data per second. Improving...


Share this page:
Follow us:
Task Runner