PHP - (Debug|Debugger) with Xdebug in Docker
About
How to debug a PHP application running in a docker container.
This articles is split in two:
- a configuration part that you need to perform only ones
- a debug part that you must perform each time you want to debug your script
Articles Related
Environment
- Browser: Firefox
- IDE: Intellij
- Docker with php 7.2, Xdebug 2.6 and Apache
Prerequisites
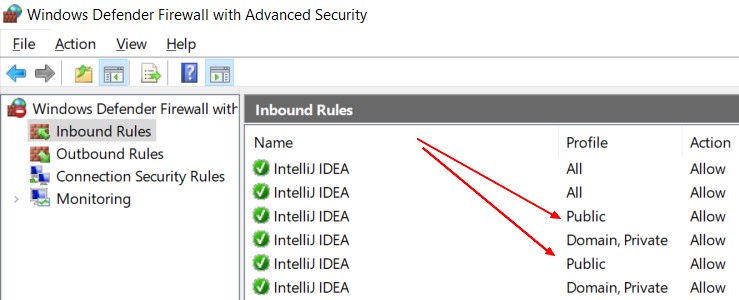
- Firewall is open for the public domain
Configuration
Docker
- go to the directory of your application and create a container with the image gerardnico/php-dev image. Example in DOS:
cd YourApplication
docker run \
    --name myapp \
    -d \
    -p 80:80 \
    -v $(pwd):/var/www/html \
    gerardnico/php-dev:7.4
cd YourApplication
docker run ^
    --name myapp ^
    -d ^
    -p 80:80 ^
    -v %cd%:/var/www/html ^
    gerardnico/php-dev:7.4
Host IP
The docker host IP (ie the IP of the laptop seen from Docker) is hard coded in the docker image.
This IP should match with yours.
The IP in your docker image can be found in the php.ini
# connect to the docker container
docker exec -it doku bash
# cat the php.ini
cat /usr/local/etc/php/php.ini | grep -i xdebug.remote_host
xdebug.remote_host=host.docker.internal
xdebug.remote_host=host.docker.internal
host.docker.internal is the default name given in a docker windows. If this property does not math your environment, you should change it.
How to find the IP can be seen here: docker host IP
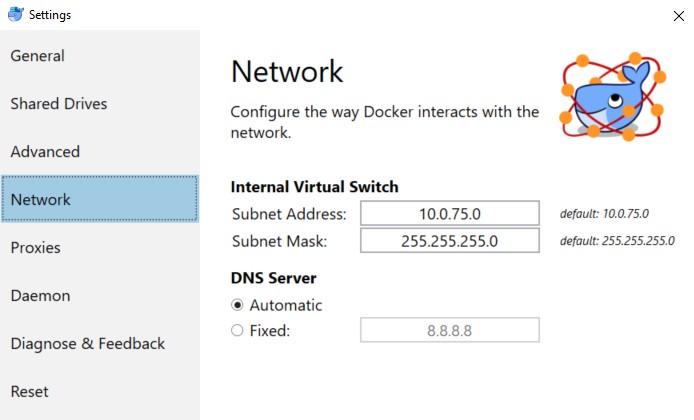
Example if you use your own subnet such as below, the IP is something like 10.0.75.1
If you want to get more information on the configuration of Xdebug. See How to install Php Xdebug ?
IDE Client Start listening
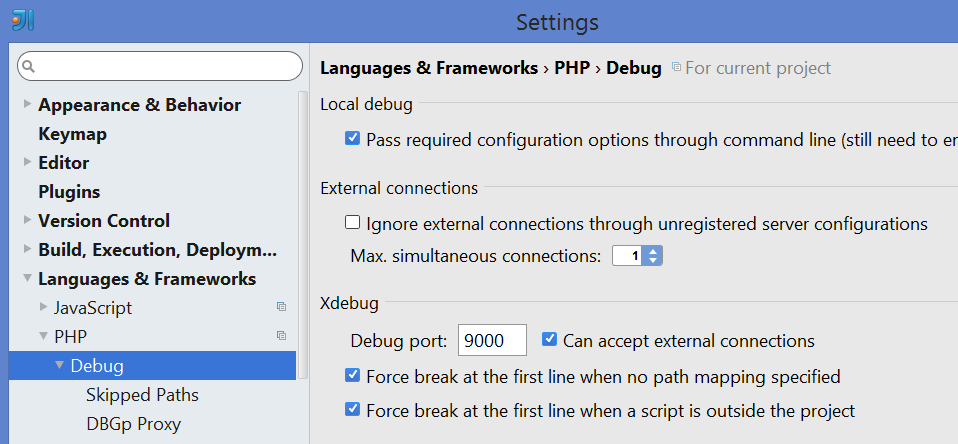
The IDE by default listen to the port 9000 but you can change it.
Example Intellij:
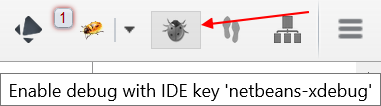
- Start listening incoming connection with you IDE (below is an Intellij snapshot)

- Verify that the Client Xdebug port (9000 xdebug version2, 9003 xdebug version 3) is listening on the IDE host. Example with tcpview.

Verify the connection from the container
- Optional verify that you have a connection from the container to your IDE host with nmap
- Start bash into the container
docker exec -it myApp bash
- Get the host and port configuration
cat /usr/local/etc/php/php.ini | grep -i xdebug
xdebug.remote_port=9000 # client_port in version 3
xdebug.remote_host=host.docker.internal # client_host in version3
- Install nmap and make a prob against the host ip or name
apt-get install -y nmap
# scan the port 9000 (xdebug version 2) or 9003 (xdebug version 3)
nmap -Pn -p T:9000 host.docker.internal
# or when nat
# nmap -Pn -p T:9000 10.0.75.1
- The output should show that the port open is (not filtered)
Starting Nmap 7.40 ( https://nmap.org ) at 2018-06-10 19:58 UTC
Nmap scan report for host.docker.internal (192.168.65.2)
# NAT: Nmap scan report for 10.0.75.1
Host is up (0.0012s latency).
PORT     STATE SERVICE
9000/tcp open  cslistener

Nmap done: 1 IP address (1 host up) scanned in 0.37 seconds
Browser
In order to activate the debugger, a special GET/POST or COOKIE parameter must be set.
It can be easily done through a browser plugin:
- Firefox = Firefox the easiest xdebug
- Chrome = Xdebug Helper
Start Debug
Now that the whole system is set up, we can start a debug session with the help of the following steps.
I use and you can see the dokuwiki application on the snapshot.
- Start listening incoming connection with you IDE (below is an Intellij snapshot)
![]()
- Add a breakpoint in your script
- Enable Xdebug in your browser
- Refresh the php page
- Accept to debug the page in your IDE (Intellij)
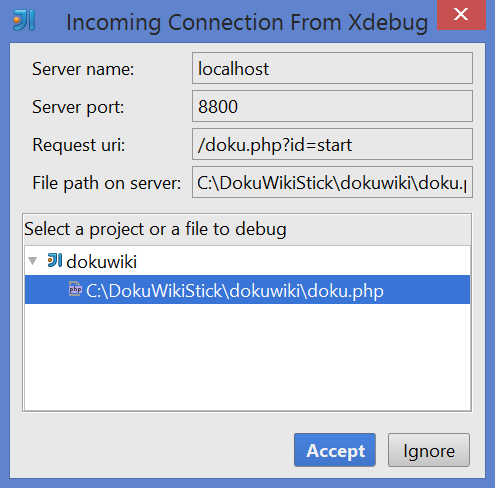
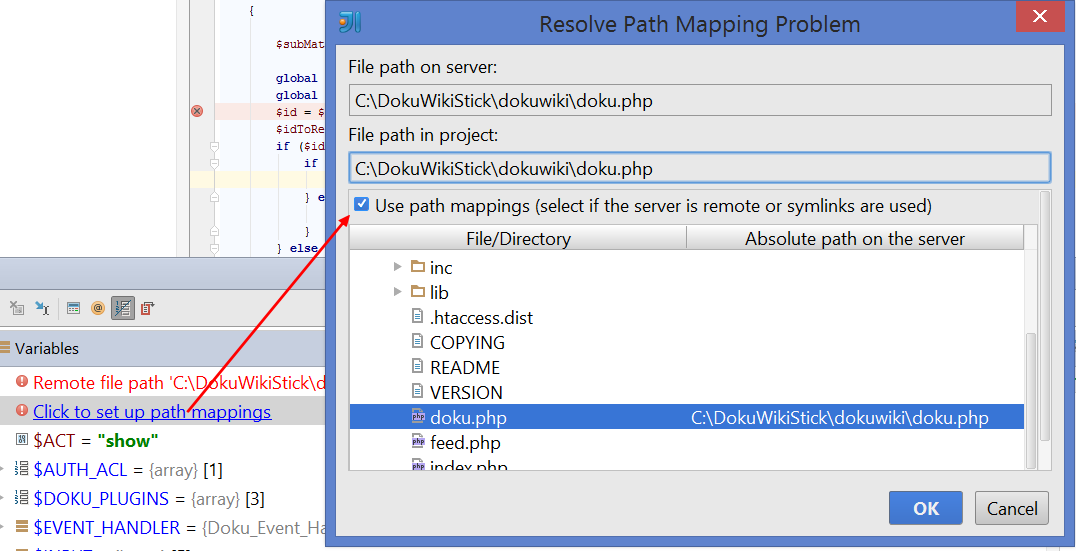
- Normally, it can't map the php script server path with the local script, you need to help him. If the same server is used for the IDE and the Web Server, you can just uncheck the blue checkbox on Intellij
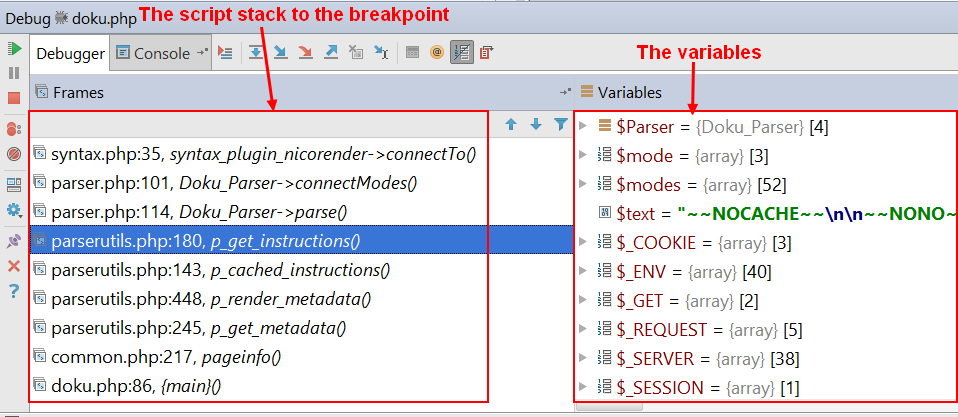
- After reaching the breakpoint the debugger is suspended and you can see the script stack and the value of the variables
Annexe
Support
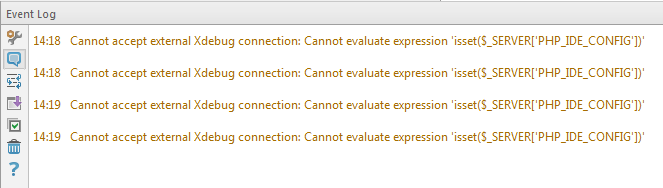
Cannot accept external Xdebug connection: Cannot evaluate expression 'isset(_SERVER['PHP_IDE_CONFIG'])'
You may see this error when an XDebug Session start.
Cannot accept external Xdebug connection: Cannot evaluate expression 'isset($_SERVER['PHP_IDE_CONFIG'])'
The environment variable PHP_IDE_CONFIG is used to define the debug server name. See Configuring path mappings in Zero Configuration Debuggin
This is because as the incoming connection doesn't match any server in your server definition, the IDE will try to read this variable.
Solution:
- Suppress all servers. The IDE will make one for you