How to install Php Xdebug ?
About
Xdebug is a php debugger and profiler.
This article show you how to install and configure xdebug on your system.
Steps
Installation
You can install 1) xdebug with one of the following possibilities
From compiled with pecl
pecl install xdebug
From source with the Wizard
- Go to the wizard
- Fill in the output of php -i
- Download the advised Dll
From the Historical list
https://xdebug.org/download/historical
Configure Xdebug
Xdebug initiates the communication to the IDE, and not the other way around, therefore the Xdebug configuration has the location (host and port) where your IDE should listen (They should match with the php IDE configuration)
Xdebug 3
doc: https://xdebug.org/docs/remote#starting A lot of parameters have changed (https://xdebug.org/docs/upgrade_guide) but the most important are the connections one. ie:
- xdebug.client_host
- xdebug.client_port (9003 no more 9000)
[Xdebug]
zend_extension=/usr/local/lib/php/extensions/no-debug-non-zts-20190902/xdebug.so

; enable the debugger
xdebug.mode=debug

; Xdebug 3 - default debugging port has changed from 9000 to 9003.
xdebug.client_port=9003
; The standard windows name
xdebug.client_host=host.docker.internal

; log
; https://xdebug.org/docs/all_settings#log
xdebug.log="/var/log/xdebug/xdebug.log"

; https://xdebug.org/docs/all_settings#log_level
xdebug.log_level = 7

; profiler on trigger
xdebug.mode = profile;
xdebug.start_with_request = trigger;
Xdebug 2
Php.ini: The important configuration parameters are:
- xdebug.remote_enable to enable the debugger
- xdebug.remote_host and xdebug.remote_port to define where the debugger should connect to.
Add the following lines in php.ini (for Php 5.3 and higher):
- The xdebug section, the path to the xdebug extension, host and port where your IDE should listen (check the php configuration of your IDE)
[Xdebug]
zend_extension=<path to php_xdebug.dll>
xdebug.remote_port=<the port where Xdebug will send the debug data> (the default port is 9000)
xdebug.remote_host =<the hostname where Xdebug will send the debug data>
- Enable debug on trigger
# debug is not always enabled
xdebug.remote_enable=0
# enabled on trigger via browser extension
xdebug.profiler_enable_trigger=1
- Enable profiling on trigger
xdebug.profiler_enable = 0
xdebug.profiler_enable_trigger = 1
# profiler storage
xdebug.profiler_output_dir=\tmp
# Specify the name of the file to store snapshots in through the value of the xdebug.profiler_output_name directive.
xdebug.profiler_output_name = "cachegrind.out.%t-%s"
; default: cachegrind.out.%p where %p is the pid
The name should always starts with cachegrind.out with a supported format specifiers
Restart the server
You should restart your web server
Verification
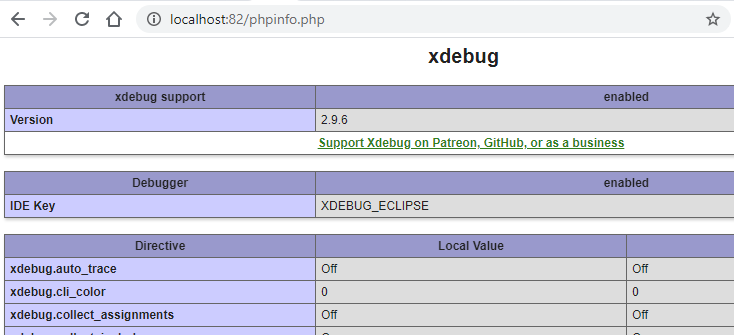
In your phpinfo, you should see a Xdebug section (Restart your server if you don't see them)
Browser Extension
To trigger a debug or profiler session from the browser, you need to install a browser extension. You can then set the debug or profile trigger easily.
- Firefox: Firefox the easiest xdebug
- Chrome: Xdebug Helper
- More … Browser debugging extension
How To
Profile with Xdebug
See How to profile with the PHP Xdebug Profiler
Extra
Docker
For Docker, use the host: host.docker.internal. For more information, see this page on how to determine the ip of your docker host.
