Web Browser - Chrome
About
Chrome is a web browser from Google based on the V8 Javascript engine.
Google Chrome is the chromium open source project built, packaged, and distributed by Google. 1)
Management
Extension
https://developer.chrome.com/extensions
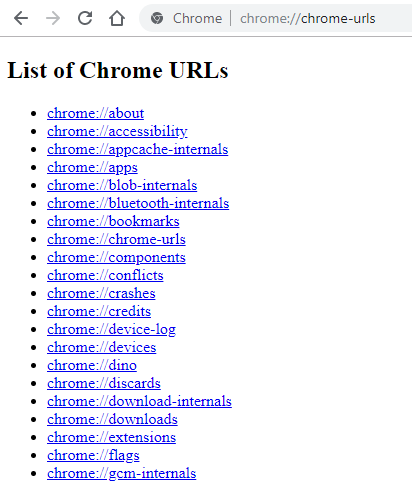
Url
Chrome URL are special chrome windows
Type in your address bar: chrome://chrome-urls/
Flags
Kill all chrome instance (background process included) before using the switch
https://www.chromium.org/developers/how-tos/run-chromium-with-flags
See:
- the available one:
- chrome://flags/
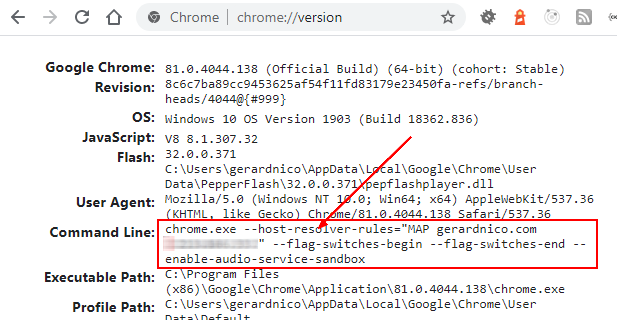
- the running one chrome://version/
Example:
chrome.exe --host-resolver-rules="MAP gerardnico.com 212.186.33.18"
DNS resolver
The switch is actually –host-resolver-rules but you may find it under the old name –host-rules
Example to map gerardnico.com to the IP 212.186.33.26
chrome.exe --host-resolver-rules="MAP gerardnico.com 212.186.33.26"
Be sure to have no background chrome process running otherwise it will not work
Other example:
--host-resolver-rules="MAP prod.example.com test.example.com,EXCLUDE localhost,EXCLUDE 127.0.0.1"
--host-resolver-rules="MAP * www.domain.de, EXCLUDE *.youtube.*"
--host-resolver-rules="MAP * www.domain.de, EXCLUDE *.youtube.*","MAP * www.domain.de, EXCLUDE *.last.fm"
--host-resolver-rules="MAP *.co.za 172.11.12.13, Exclude google.co.za"
--host-resolver-rules="MAP * www.domain.de, EXCLUDE *.youtube.*, EXCLUDE *.last.fm"
'
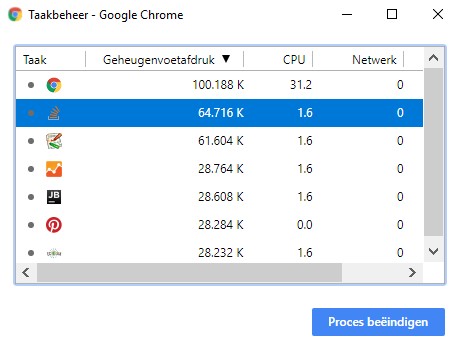
Process Explorer (Task Manager)
More Tools > Task Manager or Shift+Esc on Windows
Debugging Mode
https://chromedevtools.github.io/devtools-protocol/
The Developer Tools front-end can attach to a remotely running Chrome instance for debugging. For this scenario to work, you should start your host Chrome instance with the remote-debugging-port command line switch:
chrome.exe --remote-debugging-port=9222
You can then see:
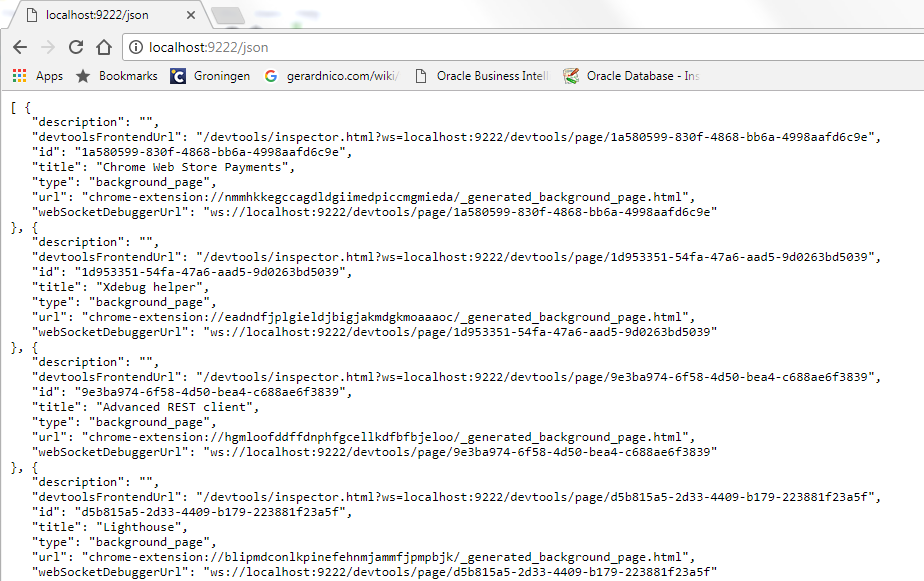
Then you can start a separate client Chrome instance, using a distinct user profile:
chrome.exe --user-data-dir=<some directory>
Now you can navigate to the given port from your client and attach to any of the discovered tabs for debugging: http://localhost:9222
Installation
- New Tab Redirect: to redirect to https://translate.google.nl/
- Ecosia
- Pinterest
- Settings:
- Pdf: don't view in Chrome
Cache
Version
chrome://version/
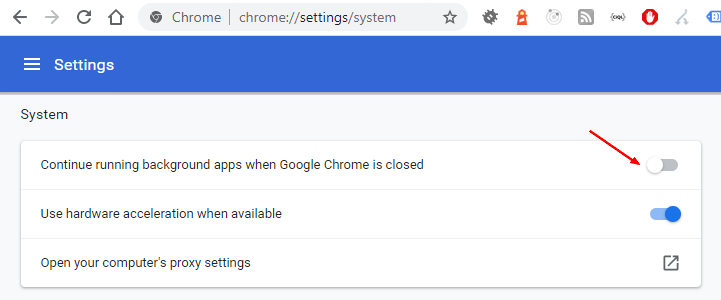
Configuration
Disable background process
chrome://settings/system