About
The Web Console is a shell embedded in the browser part of the devtool that can:
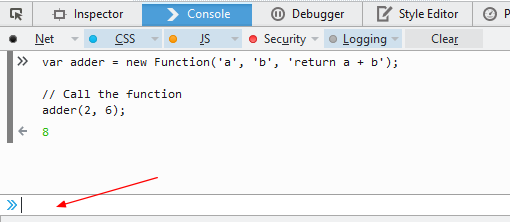
- interpret a single line of code at a time REPL
- and then interact with the page and execute JavaScript.
See also: Javascript - (Firefox) Scratchpad
- You can add message to the console through Console logging. The console keep a record of every message posted to it on any given page until the page is closed, navigated away from, or refreshed.
- Each message has a link to the file name with the line number you can navigate to.
The console is implemented as a function of window and its qualified name is window.console.
Articles Related
Browser
Firefox
Web Console > Console Message.
Css Reflow event.
Chrome
The Chrome DevTools Console panel is your focal point for direct interaction with a page in real time.
Ctrl + Shift + J or Esc in any other dev tool tab (It opens the Console Drawer)
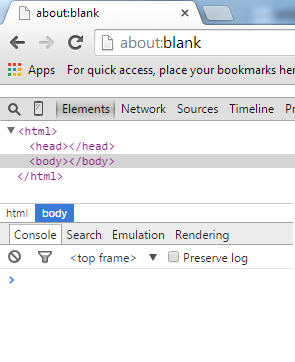
By default, logging and error output from frames or extensions contained within a page will not be output to the Console. An iframe element, for example, would create its own frame context, selectable from the dropdown menu at the top of the console
Documentation / Reference
- Chrome: go to View > Developer > JavaScript Console (guide)
- FireFox: go to Tools > Web Developer > Web Console (guide)
- IE11: go to Tools > Developer Tools > Console icon (guide)
- Safari: turn on the Develop menu: Preferences > Advanced > Show Develop menu in menu bar go to Develop > Show Web Inspector (guide)