Statistics - Correlation (Coefficient analysis)
About
Correlation is a statistical analysis used to measure and describe the relationship between two variables.
The Correlations coefficient is a statistic and it can range between +1 and -1
- +1 is a perfect positive correlation. If the scores goes up for one variable the score goes up on the other.
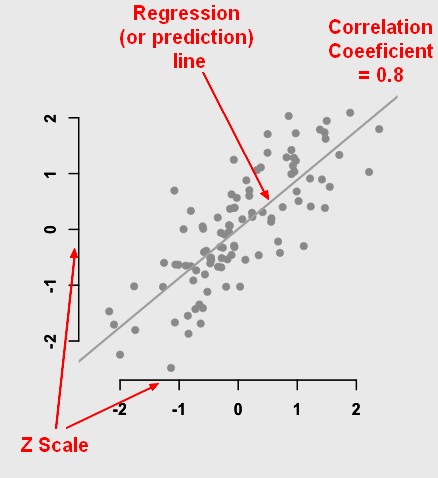
- > 0.8 is a strong correlation
- > 0.4 is a high correlation
- > 0.2 correlate
- < 0.2 is not a strong correlation
- < 0.1 doesn't correlate
- 0 is no correlation (independence)
- -1 is a perfect negative correlation. If the scores goes up for one variable the score goes down on the other.
Correlation is used:
- mainly to describe relationship
- and then it's used for prediction that leads to regression because when two variables are correlated, then one variable can be used to predict the other variable. In other words, if the variables X and Y are correlated, a regression can be used to predict Y from X.
If two variables are correlated, X and Y then a regression can be done in order to predict scores on Y from the scores on X.
Correlation demonstrates the relationship between two variables whereas regression provides an equation (with two or more variables) which is used to predict scores on an outcome variable.
Positive correlation only means that the univariate regression has a positive correlation. In a multiple regression, the sign (positive, negative) is dependent of the other variables.
Assumptions
Correlation does not imply causation
Correlation does not imply causation but correlations are useful because they can be used to assess:
Type
There are several types of correlation coefficients, for different variable types
- Pearson product-moment correlation coefficient ® (When both variables are continuous)
- Point bi-serial correlation (When 1 variable is continuous and 1 is dichotomous)
- Phi coefficient (When both variables are dichotomous)
- Spearman rank correlation (When both variables are ordinal)
Venn diagrams

Venn diagrams representation of a correlation between two variables X and Y.
Venn diagrams representing:
- All the variants in X,
- All the variants in Y
- And the overlap (the covariance). The overlap is can also be expressed as:
- the sum of the cross product between x and y (ie the covariance definition)
- the sum of the square for the model.
The degree to which x and y correlate is represented by the degree to which these two variance circles overlap. The correlation (degree|coefficient) is the systematic variance in Y that's explained by X.
The correlation is approaching:
- one for an high degree of overlap
- zero for no overlap
The residual is the unexplained variance in Y. Some of the variance in Y is explained by the model. Some if it is unexplained, that's the residual.