Statistics - P-value
About
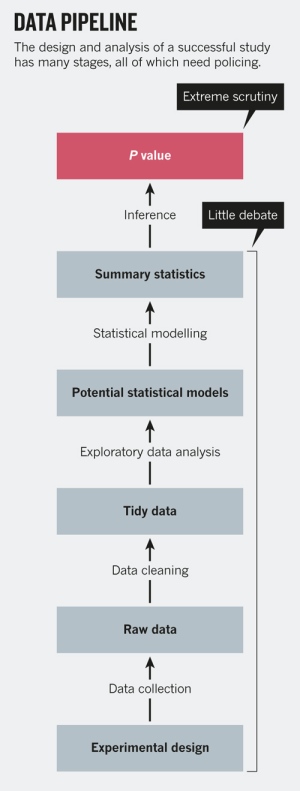
Fisher found with the a P-value a way of judging the “significance” of experimental data entirely objectively.
Fisher choose the talismanic figure 0.05 because it was mathematically convenient and thus without truly insights.
The p-value is:
- the chance that I have to see a difference if I take two control groups.
- NOT: The probability of the null hypothesis being true is p
- the probability of obtaining the data you obtain given the assumption that:
- there was no effect
- or there was no relationship in the experimentation
- or the null hypothesis is true.
When conducting a null hypothesis significance test, the p-value represents the probability of the data given the null hypothesis is true.
<MATH>p = P(D | H_0) <> P(H_0 | D ) </MATH>
where:
- D is the result of the study
- <math>H_0</math> is the null hypothesis
The p-value is based on the t-value and its corresponding t distribution which depends on the sample size. The p-value is just the area under the curve at that particular t-value and beyond..
So if you:
- are way out in the extremes, you're going to have a low p-value. You'll reject the NULL hypothesis. The parameter is not Null. There is a relationship.
- fall around the middle, then you'll have a high p-value. You'll retain the NULL hypothesis. The parameter is Null. There is no relationship.
A p-value less than 0.5 means less than 5% of the distribution are:
- in the extreme positive tail of the t-distribution
- or in the extreme negative tail of the t-distribution.
p values above 0.05 or 0.1 are not significant. They're not enough evidence against the null hypothesis, which is that the coefficient is 0.
The idea was to run an experiment, then see if the results were consistent with what random chance might produce. Researchers would first set up a 'null hypothesis' that they wanted to disprove, such as there being no correlation or no difference between two groups. Next, they would play the devil's advocate and, assuming that this null hypothesis was in fact true, calculate the chances of getting results at least as extreme as what was actually observed. This probability was the P value. The smaller it was, suggested Fisher, the greater the likelihood that the straw-man null hypothesis was false.
Most scientists would look at his original P value of 0.01 and say that there was just a 1% chance of his result being a false alarm. But they would be wrong. The P value cannot say this: all it can do is summarize the data assuming a specific null hypothesis.
The more implausible the hypothesis — telepathy, aliens, homeopathy — the greater the chance that an exciting finding is a false alarm, no matter what the P value is.
A p value measures whether an observed result can be attributed to chance. But it cannot answer a researcher's real question: what are the odds that an hypothesis is correct ? Those odds depend on:
- how strong the result was
- and, most importantly, how plausible the hypothesis is in the first place.
Articles Related
cute-off
According to a threshold value, it tells you if the results are significant.
The cute-off for the p-value is 0.05.
On paper, you can read: “The relation ship was statistically significant, p less than 0.05”

Calculation
t-value
To get a p-value, we first calculate a t-value.
If the test is two-sided:
- P-value = 2 * P( X > |observed value| )
If the test is one-sided:
- H_A
is μ > μ0
- P-value = P( X > observed value )
- H_A
is μ < μ0
- P-value = P( X < observed value )
Simulation
// Simulation parameters of 10000 sample of coin
totalTrials = 10000;
totalAboveSample = 0;
// The sample has a size of 40 and 30 of it have a face
sampleSize = 40;
totalCoinSample = 30
// Simulation
for i in range(totalTrials):
    // TotalCoinTrials is the total for a coin throws 40 times
    totalCoinTrials = randint(2, size=sampleSize )
	// Output of our sample
	if (totalCoinTrials.sum() >=totalCoinSample):
		totalAboveSample += 1

probability = totalAboveSample/totalTrials