Lighthouse
About
lighthouse - a tool for auditing an app for PWA features and checking your app meets a respectable bar for web performance under emulated mobile conditions.
Lighthouse can emulate a Nexus 5X with touch events, viewport emulation and a throttled network connection (150ms latency, 1.6Mbps throughput).
Example
It can run against a real mobile device with remote debugging.
Available as
Chrome Extension
The audit tab of devtool
- in the chrome devtool - audit tab
Cli
Online
- Online: https://developers.google.com/speed/pagespeed/insights/ - for perf
Node Library
Example where browser is the puppeteer browser object
let urlToAudit = 'http://localhost:3000/test';
let wsEndpoint = browser.wsEndpoint()
let urlChrome = new URL(wsEndpoint);

/**
 * @type {import('lighthouse').LH.Flags}
 */
const flags = {
	logLevel: 'info',
	output: 'json',
	port: urlChrome.port,
	hostname: urlChrome.hostname
};

const {lhr} = await lighthouse(urlToAudit, flags);

/**
 * Write the report as JSON
 */
let reportDataPath = `./lighthouse.json`;
fs.writeFile(reportDataPath, JSON.stringify(lhr));

/**
 * Write to the console
 */
console.log(`Lighthouse scores: ${Object.values(lhr.categories).map(c => `${c.title} ${c.score}`).join(', ')}`);
- Other example
Lighthouse at build
Lighthouse scores for the website can generated automatically at built-time.
The report may be stored at ROOT/reports/lighthouse, where ROOT is the root URL for a version of the site.
Thus, reports for the production version of the site would be available at https://example.com/reports/lighthouse.
Example in package.json:
{
  "scripts": {
    "lighthouse": "lighthouse --output html --output-path ./reports/lighthouse.html --view https://example.com"
  },
Metrics
Each score is a weighted average of each component.
Performance
Performance is a weighted average of each performance metrics.
See: https://googlechrome.github.io/lighthouse/scorecalc/
Speed index
The speed index takes the visual progress of the visible page loading and computes an overall score for how quickly the content painted.
It measures how fast the page content is visually displayed during page load.
Lighthouse first captures a video of the page loading in the browser and computes the visual progression between frames. Lighthouse then uses the Speedline Node.js module to generate the Speed Index score.
Speed Index Score
The Speed Index score is a comparison of a page's speed index and the speed indices of real websites, based on data from the HTTP Archive.
This table shows how to interpret your Speed Index score:
| Speed Index (in seconds) | Color-coding | Speed Index score |
|---|---|---|
| 0–4.3 | Green (fast) | 75–100 |
| 4.4–5.8 | Orange (moderate) | 50–74 |
| Over 5.8 | Red (slow) | 0–49 |
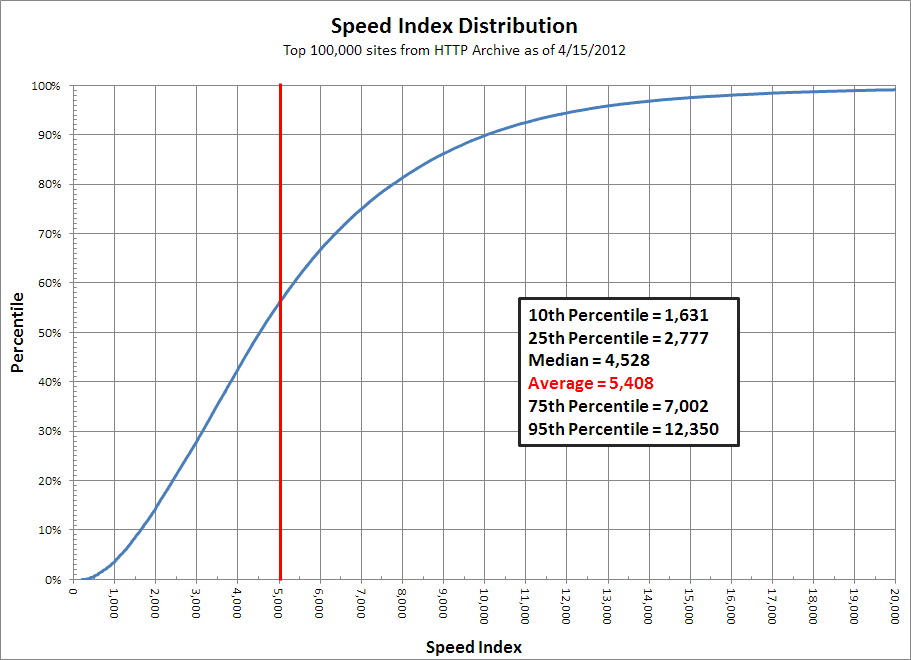
Distribution with 1.5Mbps DSL on Alexa top 100,000 from the HTTP Archive data. Graph can be seen at the WebPagetest Speed Index