About
Goal: being interactive in under 5 seconds
Duplicate of Web - Timeline of a page load (Page Speed|Page Latency).
Mobile web speeds matter.
- On average, faster experiences lead to 70% longer sessions and 2 x more mobile ad revenue.
- Investments in web perf saw the React-based, Flipkart Lite triple time-on-site
- GQ get an 80% increase in traffic,
- Trainline make an additional 11M in yearly revenue
- Instagram increase impressions by 33%.
One of the most important and basic metric that defines the performance of a website is Page Load time (perceived vs actual).
Pick a measurement tool (like Rigor, Lighthouse or PageSpeed Insights) and stick with it. Trends are more important than exact numbers.
Load Time
There are two numbers representing two different approaches how to measure the page load time:
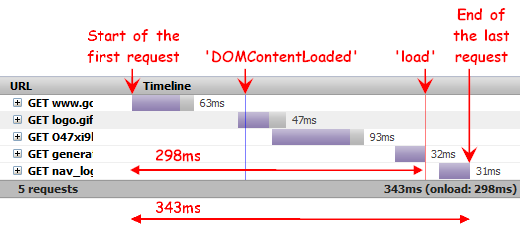
- 298ms. the load event (the red line) was fired in 298ms.
- 343ms. The total elapsed time (from beginning of the first request till the end of the second/last request) is 343ms
The DOMContentLoaded event is the blue line.
HTTP request phase:
- DNS Lookup: DNS resolution time
- Connecting: Elapsed time required to create a TCP connection.
- Blocking: Elapsed time spent in a browser queue waiting for a network connection. Displayed only in the case where this situation happens (see also this post). Each browser has a limit for number of simultaneous connections to the same server when downloading a page. If the limit is reached, other resources have to wait in an internal browser queue till a connection is released.
- Sending: Time needed to send request data to the server.
- Waiting: Waiting for the response (till the first byte is received from the server).
- Receiving: Time necessary to download response body.
Load performance Metrics
Load performance audits look at:
- First meaningful paint (when is the main content of the page visible)
- Speed Index (visual completeness)
- Estimated Input Latency (when is the main thread available to immediately handle user input)
- Time To Interactive (TTI) (how soon is the app usable & engagable). A time measure of when layout has stabilized, web fonts are visible and the main thread is available enough to handle user input.
Metrics
- Under representative network (3G) & hardware conditions
- Be interactive in < 5s on first visit & < 2s on repeat visits once a Service Worker is active.
- First load (network-bound), Speed Index of 3,000 or less
- Second load (disk-bound because SW): Speed Index of 1,000 or less.
- Time to First Paint (TTFP)
- Time to First Contentful Paint (TTFCP)
- Time to First Meaningful Paint (TTFMP)
In Chrome:
- DOMContentLoaded: blue line. The resources at the left or touching the blue line are blocking the DOM. They are known as render blocking resources.
- total load time: red line
Load Performance Model
Measuring tool
- http://yslow.org/ - Yahoo Best practice test tool. They have a list of Web Performance Best Practices and Rules
- realistic network connections (e.g Regular 3G in DevTools).
How to improve the page load ?
Others
By country
Average speed of mobile internet. (Mbps) - (SpeedTest)
- 1. Iceland: 72.5
- 2. Norway: 67.8
- 3. Qatar: 60.3
- 4. Canada: 59.6
- 6. Australia: 55.7
- …
- 28. France: 38.7
- 33. Turkey: 34.7
- 41. US: 31.2
- 49. China: 28.9
- 52. UK: 28.3
- 54. Saudi: 27.1
- 70. Brazil: 20.5
- 77. Russia: 18.4
- 111. India: 9.9

