What are Application Metrics? ie Perfcounter, Performance Metrics, Operational data, Monitoring, telemetry
About
This section is about the collection and calculation of metrics in the monitoring context.
These (counter|numbers) are or we will derive averages from them. There is no way to figure out from the data, if you got from one point to another in an horizontal and constant line.
Type
Primitives Metrics Type are called statistical collector
Characteristics
Registry
They are generally locally grouped in a registry in order to batch the data collection.
Dimensionality
Time serie data may be classified via:
- dimension - the event is enriched with tag key/value pairs. (AppOptics, Atlas, Azure Monitor, Cloudwatch, Datadog, Datadog StatsD, Dynatrace, Elastic, Humio, Influx, KairosDB, New Relic, Prometheus, SignalFx, Sysdig StatsD, Telegraf StatsD, Wavefront)
- hierarchy - the name is a flat hierarchical metric name (Graphite, Ganglia, JMX, Etsy StatsD)
- or both
dimensions are also known as tags
Hierarchy Example :
- Atlas (CamelCase)- httpServerRequests
- Graphite (Point separator)- http.server.requests
- InfluxDB and Prometheus separated by _ - http_server_requests
Aggregation Processing
The aggregation of a set of samples over a prescribed time interval (Rate aggregation) may be performed:
- Client Side (AppOptics, Atlas, Azure Monitor, Datadog, Elastic, Graphite, Ganglia, Humio, Influx, JMX, Kairos, New Relic, all StatsD flavors, SignalFx)
- or Server-side (Prometheus, Wavefront)
Example: conversion of discrete samples (such as counts) to a rate.
Not all measurements are reported or best viewed as a rate. For example, gauge values are not rates.
Metrics Collection
The collection of metrics may be done:
- client side via client pushes (AppOptics, Atlas, Azure Monitor, Datadog, Elastic, Graphite, Ganglia, Humio, Influx, JMX, Kairos, New Relic, SignalFx, Wavefront)
- server side via server polls (Prometheus, all StatsD flavors)
Steps / Lifecycle
They are:
- produced by:
- instrumentation and consumed by a metrics collector
- stored in a server (time serie database)
Alerting:
Category
Machine data example:
Sensor
- temperature,
- speed,
- voltage,
- number of printouts
- …
Service Metrics
See SLI: Service Level Indicators:
- Resource metrics (CPU, Memory,…)
- and process metrics
Event
Some monitoring systems can also capture events:
- Changes: Internal code releases, builds, and build failures
- Alerts: Internally generated alerts or third-party notifications
- Scaling events: Adding or subtracting hosts
Property
Scale and Persistence
- last 2 hours at 1 minute resolution,
- last 24 hours at 10 minute resolution,
- last 3 days with 1 hour resolution,
- last 7 days at 2 hours resolution
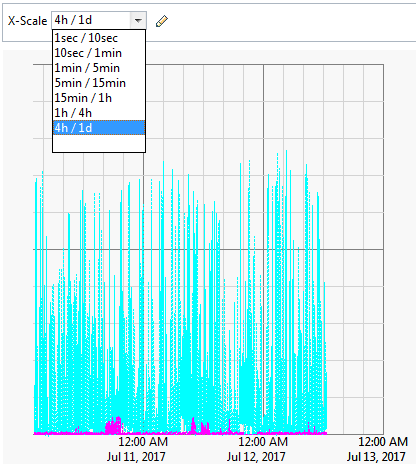
X-scale (Minor/Major Tick)
Reference
- CSE 141 - Performance I and II