R - Ggplot
About
ggplot is a graphic library that follows the grammar of graphics.
Plot Components
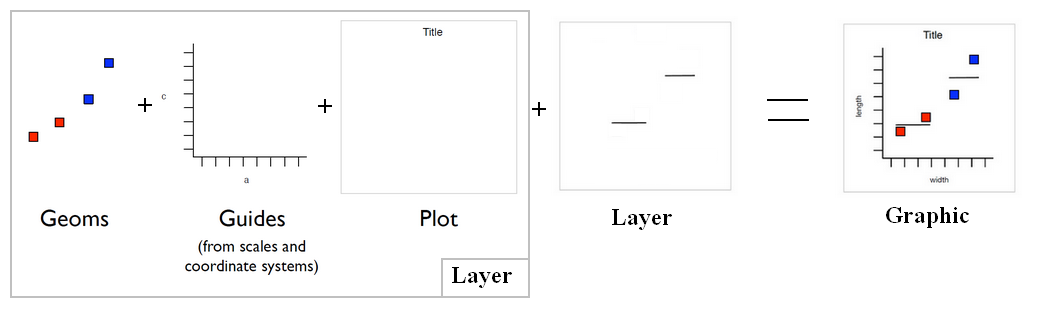
charts are made of :
- layers that are made of:
- geometries: the graphical element like a point, a bar or a line
- aesthetics: the data of the graphic (ie where and how the geometries are to be placed such as the coordinates x, y)
- stat: the data transformation before plotting. (for instance = binning for an histogram) - The Statistical transformation
- GGplot - Guide (axis or legend): An axis or legend
Usage
Initialization
ggplot(df, aes(x, y, <other aesthetics>))
will define as default for all layers
- the data
- and the aesthetics
Without any argument, ggplot initializes a skeleton ggplot object which is fleshed out as layers are added.
Adding Layers
ggplot() is typically used to construct a plot incrementally, using the + operator to add layers to the existing ggplot object. This is advantageous in that the code is explicit about which layers are added and the order in which they are added.
Plot = ggplot(data, mapping) +
layer(
  stat = "",
  geom = "",
  position = "",
  geom_parms = list(),
  stat_params = list(),
)
where:
Example: Layers are created with the layer function but usually they are created directly through the shortcut functions geom_* (geom_point is a layer with a point geom) or stat_*)
d <- ggplot(diamonds, aes(x=carat, y=price))
d + geom_point()
d + geom_point(aes(colour = carat))

ggplot(diamonds) + geom_histogram(aes(x=price))
where:
Blog
Documentation / Reference
- A Layered Grammar of Graphics - Hadley WICKHAM - introduction paper of Ggplot