GGplot - Coordinate System
About
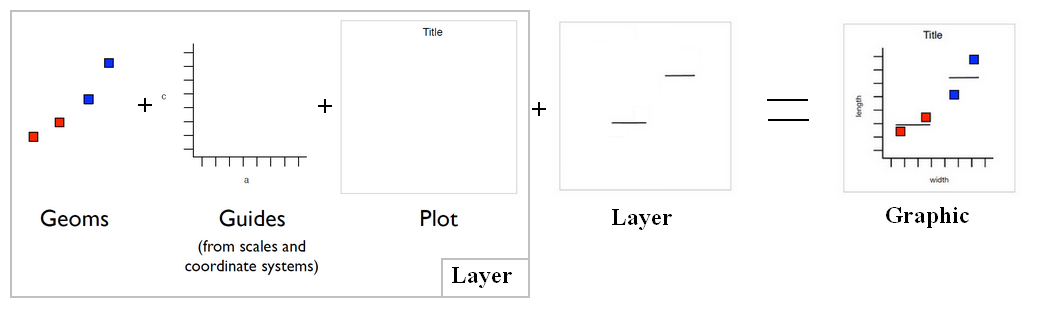
coordinate system control how the two coordinates aesthetics work together (default: Cartesian)
Others:
- coord_flip() - Flip x and y
- coord_map()
- coord_polar()
They Occur after statistics and affect the appearance of geoms
Articles Related
Zooming
You can zoom to an area by setting the x and y limit.
coord_cartesian(xlim=c(10,130))
where:
- 10 is x_low
- 130 is x_high