GGplot - Stat - (Statistical transformation|Statistic)
About
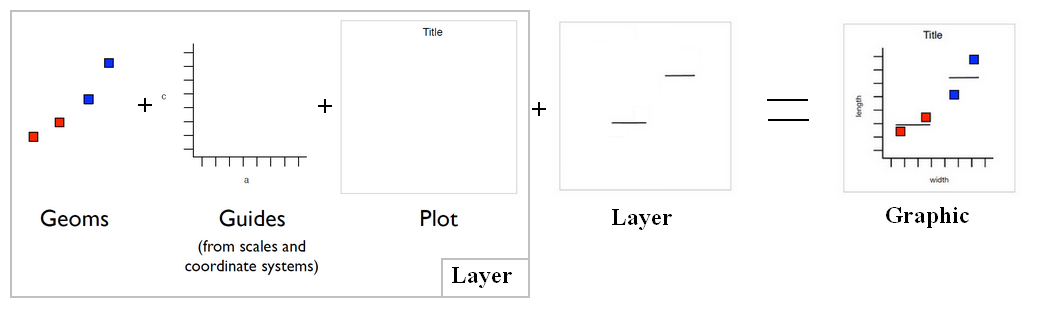
The Statistical transformation (stat). Multiple layers, statistical transformation.
It's often useful to transform your data before plotting, and that's what statistical transformations do.
Articles Related
Stat, geom relation
Every geom function has a default statistic:
- geom_smooth = stat_smooth + ribbon
- geom_density = stat_density + ribbon
And every statistic function has a default geom.
- stat_…
List of statistic
| Statistic | Explanation |
|---|---|
| stat_bin | Statistics - (Discretizing|binning) (bin) |
| stat_smooth | Statistic - Smooth (Function Continuity) (Soft ?) |
| stat_density | Statistics - (Probability) Density Function (PDF) |
Some statistics produce new data frame variables in the data. stat_bin produces count and density.
Management
Mapping a new stat to an aesthetic
Some statistics produce new data frame variables in the data.
Example: stat_bin produces count and density.
To map an aesthetic to one of the new stat variables, surround it with ..
p = ggplot(diamonds, aes(x=price))
p + geom_histogram(aes(y = ..density..))
p + geom_histogram(aes(colour = ..count..))
Separation of statistics and geometric elements
Ggplot - Geom (geometric objects) - type of plot
p <- ggplot(diamonds, aes(x=price))
p + stat_bin(geom="bar") # Equivalent to p + geom_histogram()
p + stat_bin(geom="area")
p + stat_bin(geom="point")
p + stat_bin(geom="line")