Ggplot - Geom (geometric objects) - type of plot

Ggplot Graphic Plot

About

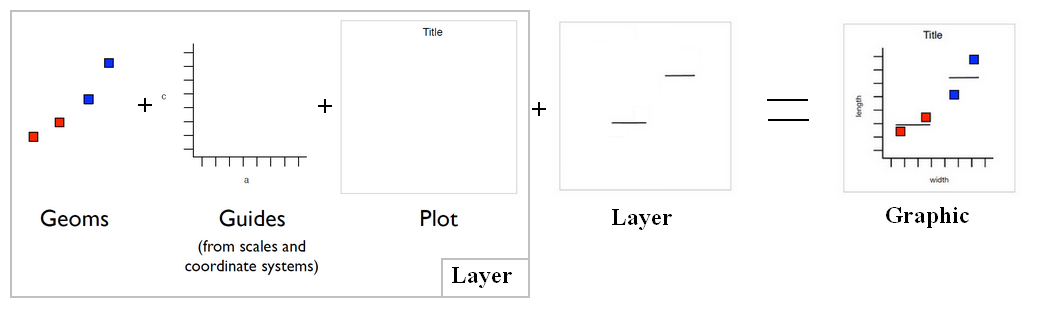
Geom is a short for geometric objects that describe the type of plot produced.

  • point for point (to create a scatterplot)
  • line for a line

The geom_… functions are shortcuts for a layer set to a geom with a default statistic.:

  • geom_point is layer with a point geom

Shape

Geoms define the basic “shape” of the elements on the plot


Discover More
Ggplot Graphic Plot
GGplot - Coordinate System

coordinate system control how the two coordinates aesthetics work together (default: Cartesian) Others: coord_flipcoord_flip() - Flip x and y coord_map() coord_polar() They Occur after statistics...
Ggplot Graphic Plot
GGplot - Layer (data + mapping + geom + stat + position)

Layer = data: The data frame (in a variable or a function, if null inherited) + mapping: Mapping data to geom properties (ie aesthetics) + geom : The geometric object to use display the data +...
Ggplot Graphic Plot
GGplot - Line Geom

line geom Reference lines (sometimes called rules) are useful for annotating plots. geom_ablinegeom_abline: diagonal - (specified by slope a and intercept b ) geom_ablinegeom_hline : horizontal...
Ggplot Graphic Plot
GGplot - Polygon Geom

The polygon in Ggplot A polygon is a geom. It will tie together points with line that will not intersect each others.
Ggplot Graphic Plot
GGplot - Stat - (Statistical transformation|Statistic)

The Statistical transformation (stat). Multiple layers, statistical transformation. It's often useful to transform your data before plotting, and that's what statistical transformations do. Every...
Ggplot Graphic Plot
Ggplot - Bars, rectangles with bases on x-axis (Geom_bar)

A bar geom makes the height of the bar proportional to: the number of cases in each group (default) or the sum of a column (using the weight aesthetic) The geom_bar layer is used to produce 1d area...
Ggplot Scatterplot Factor Value Ordererd
Ggplot - Point (geom_point, geom_jitter) (Scatterplot)

A geom point to create Scatterplot geom_jitter is a shortcut for geom_point(position = “jitter”) Points are jittered to reduce overplotting.
Ggplot Graphic Plot
Ggplot - Smooth (Geom_Smooth|Stat_Smooth)

smoothing in Ggplot Smooth (Smoothed conditional means) is seen as a: stat - mean calculation and a geom - line or point geom_smoothstat_smooth() is a layer and an alias of geom_smoothgeom_smooth()....
Ggplot Graphic Plot
Ggplot - Text geom

geom text geom_text
Ggplot Graphic Plot
R - Ggplot

ggplot is a graphic library that follows the 0387245448grammar of graphics. charts are made of : layers that are made of: Data geometries: the graphical element...


Share this page:
Follow us:
Task Runner