Data Visualization - Box Plot

Utah Teapot

About

A box plot is a good summary of a distribution and was invented by John Tukey.

See wiki/Five-number summary

The boxplot is a special case of the quantile function in that it only returns the 1st, 2nd and 3rd quantile.

Box plots are useful for comparing distributions, especially when you have multiple observations of the same event.

Definition

Box Plot

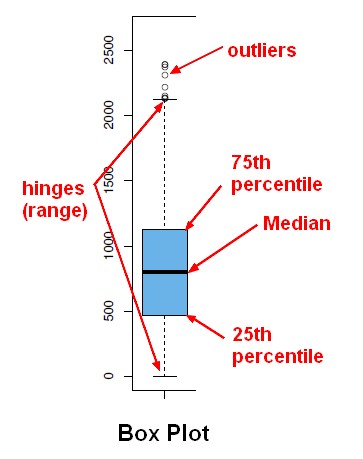
  • The black line is the median.
  • The top and bottom of the box are the quartiles.
    • the 75th percentile is the top of the box
    • the 25th percentile is the bottom of the box.
  • A hinge is defined to be a fraction of the interquartile range and gives an indication of the spread.
  • if data points fall outside the hinges, they're considered to be outliers.


Discover More
Anomalies Election Fraud
Data Mining - (Anomaly|outlier) Detection

The goal of anomaly detection is to identify unusual or suspicious cases based on deviation from the norm within data that is seemingly homogeneous. Anomaly detection is an important tool: in data...
Utah Teapot
Data Visualization - Visual (or Mark)

A visual is an object created from visual primitive that gets the value of its properties from the data. See also: Visual Encoding Bar (ie rectangle) Point (ie Circle or Square) Line Area...
Utah Teapot
Data Visualization Foundation

The Utah Teapot. Data visualization is the process of mapping quantitative data to visuals (shapes, color, position, etc) to create a graph made of geometric object. Information visualization: ...
Ggplot Graphic Plot
Ggplot - Boxplot

in Ggplot. geom_boxplot
Ggplot Graphic Plot
Ggplot - Geom (geometric objects) - type of plot

Geom is a short for geometric objects that describe the type of plot produced. point for point (to create a scatterplot) line for a line ... The geom_... functions are shortcuts for a layer set...
Data System Architecture
Quantile - Quantile Visualization

Quantile may be visualized in quantile plot
Thomas Bayes
Statistics / Probability - Distribution - (Function)

This section talks the term Distribution also knows as Probability distribution where you get: on the y axis, the probability on the x axis, the event They can be seen as the outcomes of a single...


Share this page:
Follow us:
Task Runner