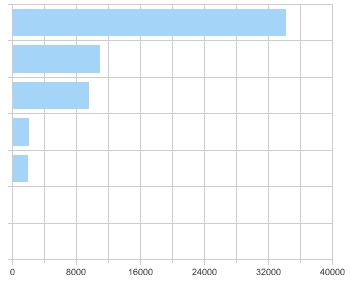
Data Visualization - Bar Chart
About
Bar graphs plots:
- associated with quantities (number of case, sum of)
whereas an histograms plots:
- associated with its bins
They show:
- quantities as bar lengths
- and categories as bars or groups of bars.
They show
The bars can be in a horizontal or vertical direction.
Articles Related
Example
- competing product sales, same product sales over different time periods,
- same product sales over different markets.
Subtype
- Vertical
- Horizontal
- Stacked Vertical
- Stacked Horizontal
Styles
- Rectangle
- Triangle
- Cylinder
- Diamond
- Gradient
- Pattern Fill