About
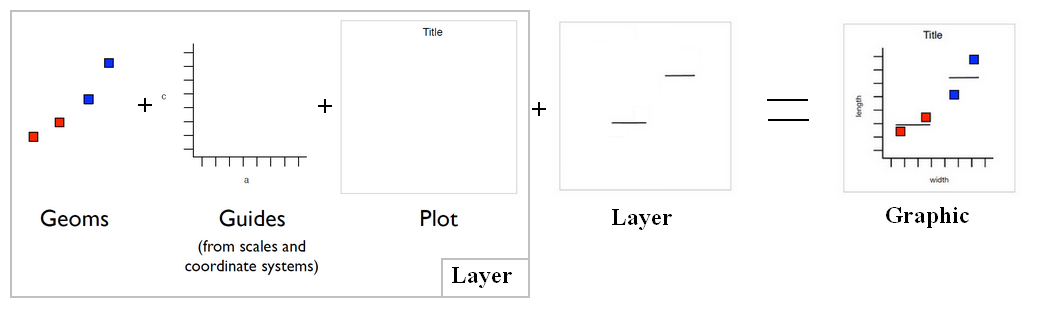
A geom point to create Scatterplot
Articles Related
Management
Size
geom_point(aes(size = qsec))
Jitter to reduce overplotting
current/geom_jitter.html is a shortcut for geom_point(position = “jitter”)
Points are jittered to reduce overplotting.
geom_jitter(width = 2, height = 5, alpha = 0.5)
Example
Categorical Data Ordered By Continuous Value
f = factor(c('six','one', 'two','three','four','five'))
x = c(4,1,5,2,10,3)

# We re[[order|order]] the factor by x
f <- reorder(f,x,sum)
#  where:
#     * f is a factor of length n,
#     * x is a vector of length n (It can also be negative if the sort must be descendant)
#     * the third parameter is a function (sum, median) that the lapply function supports.

ggplot()+geom_point(aes(x=x,y=f))
