About
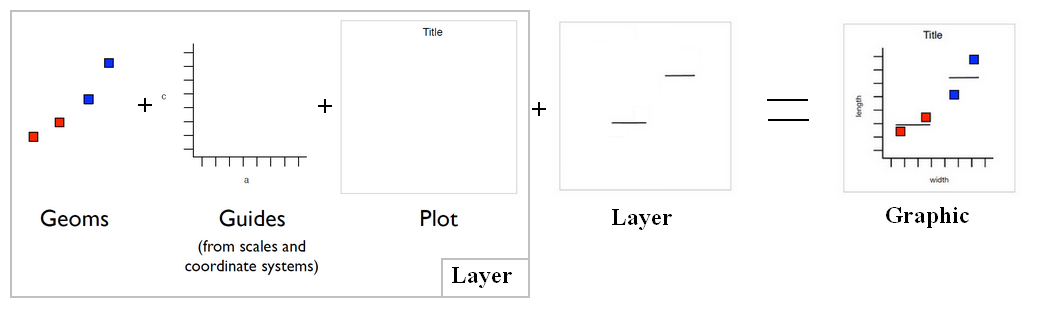
Scales control the mapping between data and aesthetics, and control the display of the matching guide (axis or legend)
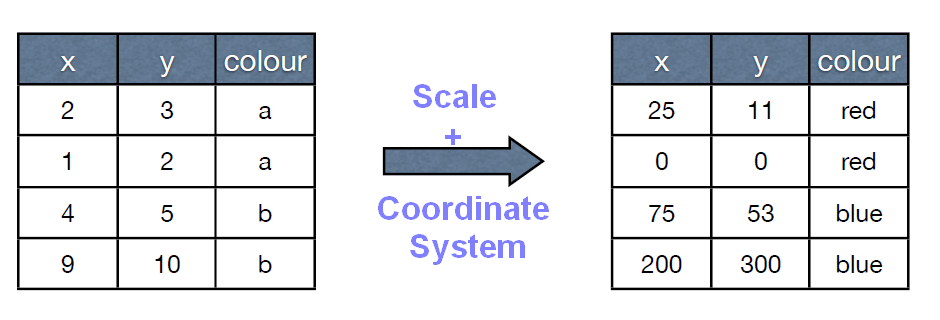
Ex: Linear scaling of x and y axes (scales)
See:
- current/scale_linetype.html (Scale for line patterns)
Articles Related
Definition
Basic
- Change name and range or limits
- All scales take name as first argument
- axis or legend name
- can be an expression
- All position scales also take limits argument
- Any data outside of limits is not plotted (but is still used for computation)
Position scales
- Can be used to plot on non-linear scales (scale_x_log10, scale_x_sqrt, …)
- Can also control exactly where breaks occur (with breaks argument) and the amount of extra space on the borders (with the expand argument)
Colour/fill
Colour/fill probably most commonly manipulated
- discrete: hue, brewer, grey, manual
- continuous: gradient, gradient2
- identity
Management
Suppression
Example:
scale_x_continuous(NULL, breaks = NULL) +
scale_y_continuous(NULL, breaks = NULL)
Documentation
See scale in the doc