GGplot - Line Geom
About
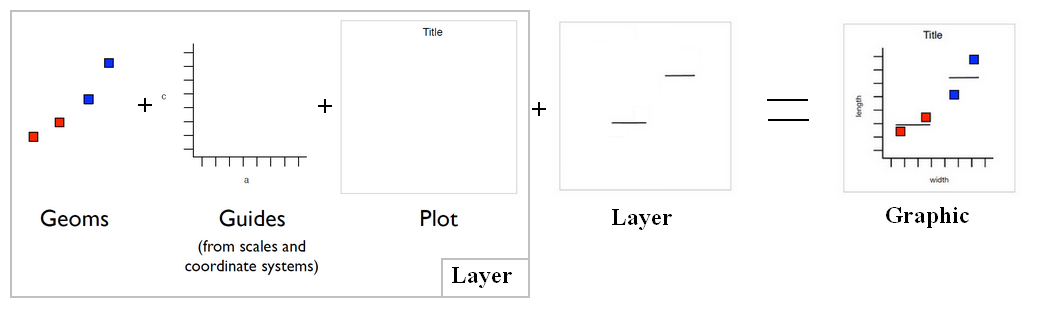
line geom
Articles Related
Rules
Reference lines (sometimes called rules) are useful for annotating plots.
- geom_abline: diagonal - (specified by slope a and intercept b )
- geom_hline : horizontal
- geom_vline: vertical
Line Configuration
- current/geom_segment.html: straight line
- current/geom_curve.html: curved line
lty <- c("blank", "solid", "dashed", "dotted", "dotdash",
     "longdash","twodash")
linetypes <- data.frame(
  y = seq_along(lty),
  lty = lty
)
ggplot(linetypes, aes(0, y)) +
  geom_segment(aes(xend = 5, yend = y, linetype = lty)) +
  scale_linetype_identity() +
  geom_text(aes(label = lty), hjust = 0, nudge_y = 0.2) +
  scale_x_continuous(NULL, breaks = NULL) +
  scale_y_continuous(NULL, breaks = NULL)