About
A classifier is a Supervised function (machine learning tool) where the learned (target) attribute is categorical (“nominal”) in order to classify.
It is used after the learning process to classify new records (data) by giving them the best target attribute (prediction).
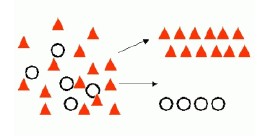
Rows are classified into buckets. For instance, if data has feature x, it goes into bucket one; if not, it goes into bucket two.
The target attribute can be one of k class membership.
To summarize the results of the classifier, a Confusion matrix may be used.
- classification: The learned attribute is categorical (“nominal”)
- regression: The learned attribute is continuous numeric value
Type
In classification, there is two kind of problem:
- binary
- multi-class
One
One class classification: Data Mining - (Anomaly|outlier) Detection
Binary
A two class problem (binary problem) has possibly only two outcomes:
- “yes or no”
- “success” or “failure”
Multi-class
A multi-class problem has more than two possible outcomes.
Example
| Example | Prediction | Illustrate the Model |
|---|---|---|
| Filter Spam | Yes or No | Binary Classification |
| Purchasing Product X | Yes or No | Binary Classification |
| Defaulting on a loan | Yes or No | Binary Classification |
| Failing in the manufacturing process | Yes or No | Binary Classification |
| Producing revenue | Low, Medium, High | Multi-class Classification |
| Differing from known cases | Yes or No | One-class Classification |
Mathematical Notation
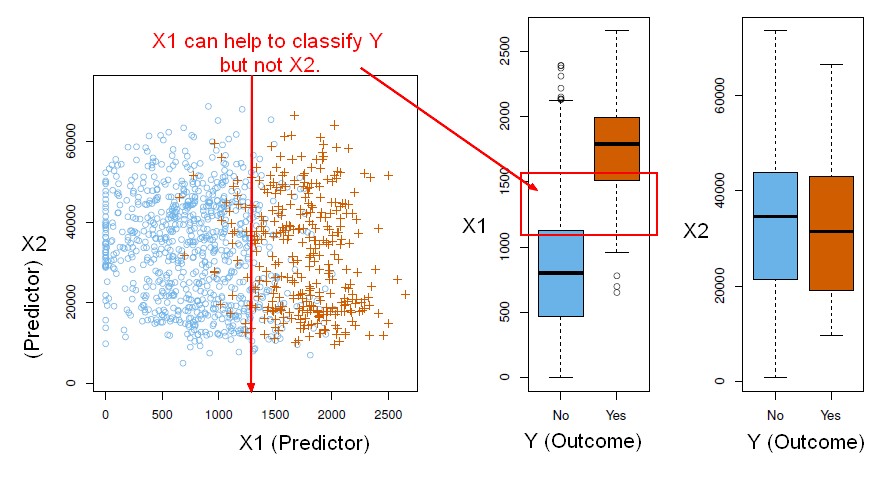
The classification task is to build a function that takes as input the feature vector X and predicts its value for the outcome Y i.e.
<math> C(X) \in C </math> where:
- X is a feature vector
- Y is a qualitative response taking values in the set C
C of X gives you values in the set C.
Probabilities
Often we are more interested in estimating the probabilities (confidence) that X belongs to each category in C.
For example, it is more valuable to have an estimate of the probability that an insurance claim is fraudulent, than a classification fraudulent or not.
You can imagine, in the one situation, you might have a probability of 0.9 the claim is fraudulent. And in another case, it might be 0.98. Now in both cases, those might both be above the threshold of raising the flag that this is a fraudulent insurance claim. But if you're going to look into the claim, and you're going to spend some hours investigating, you'll probably go for the 0.98 first before the 0.9. So estimating the probabilities is also key.
Data Analysis
Data (Analysis|Analyse|Analytics)
Data structure / Model
Most of the algorithms are based on this data structure (knowledge representation):
- Probability: Attributes contribute equally and independently, not black-or-white classification: Data Mining - Naive Bayes (NB)
- Decision tree: A decision tree that tests a few attributes: Data Mining - Decision Tree (DT) Algorithm
- Training set: Calculate distance from training instances: Machine Learning - Rote Classifier and Machine Learning - K-Nearest Neighbors (KNN) algorithm - Instance based learning
- Regression: Result depends on a linear combination of attributes: Machine Learning - Linear (Regression|Model)
Logistic Regression versus LDA
- Logistic regression uses the conditional likelihood based on Pr(Y|X) (known as discriminative learning).
- LDA uses the full likelihood based on Pr(X|Y) (known as generative learning).
- Despite these differences, in practice the results are often very similar.
Summary
- Logistic regression is very popular for classification, especially when K = 2.
- LDA is useful when n is small, or the classes are well separated, and Gaussian assumptions are reasonable. Also when K > 2.
- Naive Bayes is useful when p is very large
Model Accuracy
Others
MaxEnt and SVM uses another mathematical models and feature weight selection then Naive Bayes. The feature are more weighed.
Example
Given demographic data about a set of customers, predict customer response to an affinity card program