About
The entity-relationship (E-R) diagram is a diagram that helps visualize relational data models and shows relationships between relation (ie the entities)
ER modeling technique was first developed by Peter Chen in 1976 and described in two papers
A lot of graphical variation has been developed but they resolve all around the same entity-relationship concept..
Articles Related
Example

Syntax
The building blocks of the ERD in a relational model are:
- relations (table, view, ..) - ie the entities that describe people, places, or things
- columns - ie the attributes the capture information about the entity
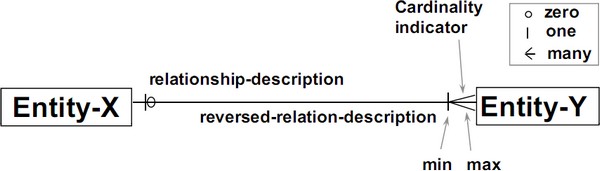
- relationship and their cardinality that depict the data association across relation
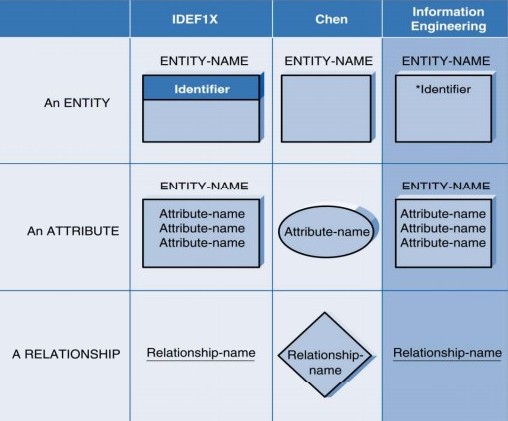
Chen definition:
- each entity set is represented by a rectangular box,
- and each relationship set is represented by a diamond-shaped box.
E-R diagram in a DSS system
With the growth of the machine power, this point of view is now not always true
Typically, E-R schemas have many tables, sometimes hundreds or even thousands. There are many tables because the data has been carefully taken apart—normalized, in database terminology—with the primary goal of:
- reducing data redundancy
- and bringing about fast update performance.
E-R models are very efficient for OLTP databases. When E-R databases are queried, joins are usually predetermined and can be optimized. E-R databases are usually queried by applications that know exactly where to go and what to ask. These applications typically query small units of information at a time, such as a customer record, an order, or a shipment record.
E-R schemas generally do not work well for queries that perform historical analysis due to two major problems—poor performance and difficulty in posing the question in SQL:
- Performance problems persist with historical E-R queries because the queries require the database to put the data back together again; this is a slow, complex process. Furthermore, because the cost-based optimizers in database management systems are not designed for the level of complexity in such a query, they can generate query plans that result in poor performance.
- A Database Analyst (DBA) who is very familiar with the data might be able to write a SQL query against an E-R schema that can theoretically answer a business question, but such detailed knowledge of the data is generally beyond the scope of the end user business analyst. Even when the SQL is crafted properly, there is often an unacceptably high response time in returning results to the user.
Alternative Notations
Alternative Notations
Cardinality
This sections shows the different Entity-Relationship graphical variations in terms of cardinality

List
- wiki/Chen-Notation (Original)
FYI:
Software / Library
Mermaid
Mermaid offers a simple markup syntax to create ERD that you can create with their live editor or embed in your web application
Example:
erDiagram
    CUSTOMER ||--o{ ORDER : places
    ORDER ||--|{ LINE-ITEM : contains
    CUSTOMER }|..|{ DELIVERY-ADDRESS : uses