Relational Data Modeling - Visualization

Data System Architecture

About

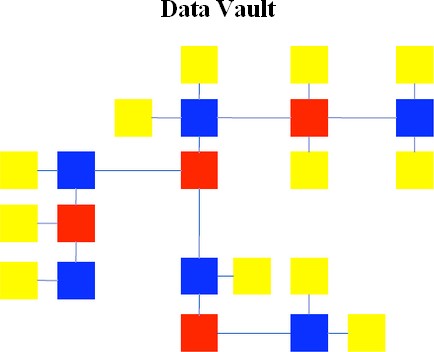
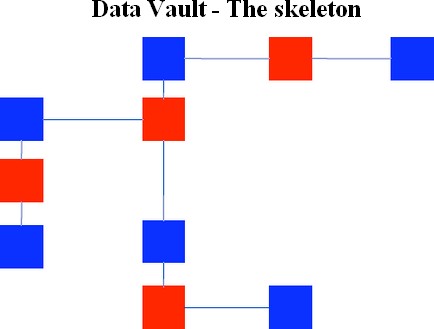
The vizualization of a relational data model is done as a sepecialized Entity relationship diagram.

Erd Graphical Notation

A best practice is to draw the child table above the parent table.

Color

One way to see the different data models is to colour the relation by the main characteristic of their columns.

Colours Legends

Main attributes Colour
Business Keys Blue
Foreign Keys (Associations Details) Red
Attributes (Details) Yellow

Figures

3nf Color Star Schema Color
Data Vault Colour Data Vault Skeleton Colour

Documentation / Reference

  • Data Vault Presentation


Discover More
Data System Architecture
Relational Data Modeling

This section is data Modeling applied to a relational structure (mostly table). Relational databases normalize data, removing as much duplication as possible. A relational database’s approach to...
Cardinality Representation Erd
Relational Data Modeling - Entity-Relationship Diagram (ERD)

The entity-relationship (E-R) diagram is a diagram that helps visualize relational data models and shows relationships between relation (ie the entities) ER modeling technique was first developed by Peter...


Share this page:
Follow us:
Task Runner