About
Page load is the latency performance metrics that cumulates:
- TCP latency (ie how fast, the network will receive the HTTP request and send back the HTTP response )
- HTTP latency (ie how fast the web server will create an HTTP document)
- and HTML latency (ie how fast a page will be rendered by the browser)
You may be also interested by the web speed page (possible duplicate)
Timeline / State / Phase / Moment
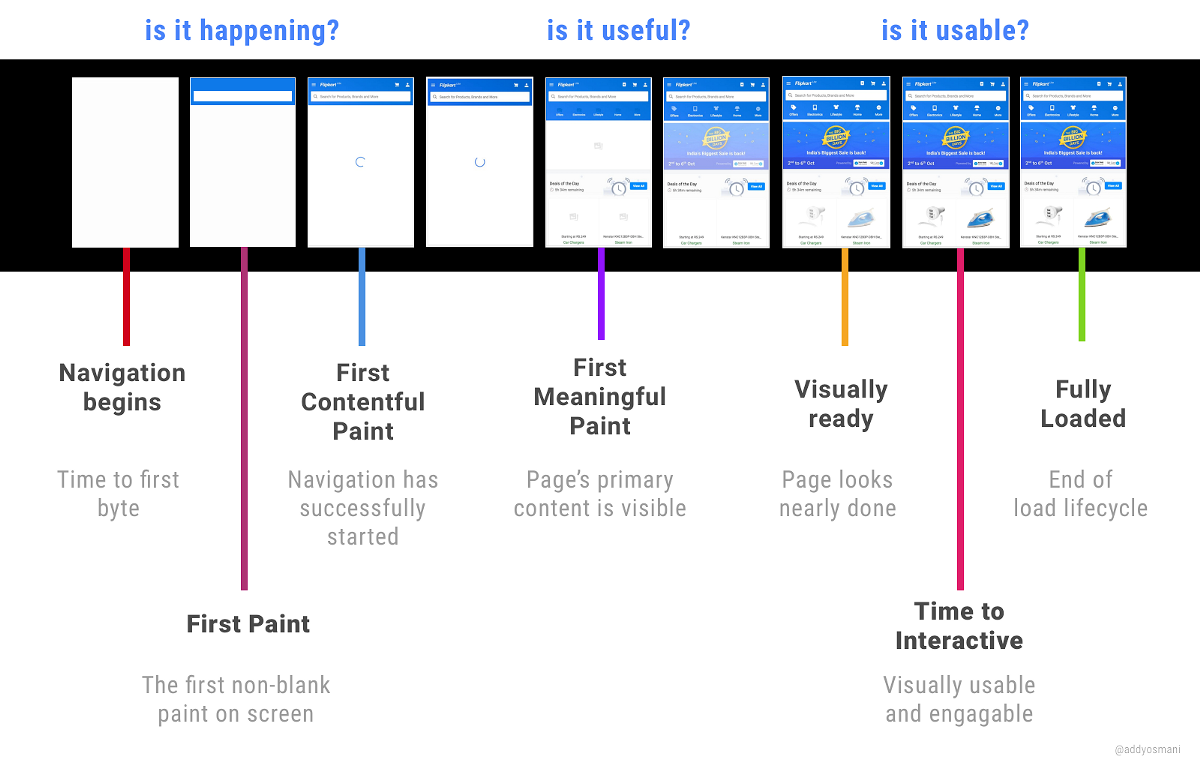
Load is not a single moment in time — it’s an experience that no one metric can fully capture. There are multiple moments during the load experience that can affect whether a user perceives it as fast or slow.
The main page state of the loading process are available in the readyState property
Navigation
The user begins a page load with a navigation:
- a click on a link
- an URL in the address bar.
This navigation will make the browser execute an HTTP request to retrieve the HTML page.
HTML Loading
Browser - Page loading - The HTTP response has been received.
Metrics:
HTML Parsing
Top down
HTML code is processed by the browser in the order it appears in the file. Ie the code on the page (ie HTML, CSS, Javascript, …) is processed top down
Demo: Click on the button to start loading the HTML
<script>alert('The image is not yet downloaded because this alert is blocking. Click on the Ok button to close the alert, to resume the load process and load the image');</script>
<img src="/_media/lenna.png" width="200px"/>
Explanation:
- When the page is loaded, the browser execute the alert, the alert window will pop up and the page stops loading until the alert window is closed. Ie in this case, you will not see the image until you close the alert.
Parsing: Object Model build (DOM)
In this phase, the browser will build the DOM document from the HTML document received in the response.
Event:
- DomContentIoaded event is fired (same as ) when the DOM document has been build
Metrics:
- Page Load - Content Load Time - The amount of time to fully load the HTML and build the DOM (external resources like images & stylesheets not yet loaded).
Loading Resources
In this phase, the browser will fetch resources present in the HTML page.
If the linked resources are:
- css stylesheet: they will be added to the CSS Object Model and trigger a re-rendering
- javascript: they will be executed depending on the async or defer attribute
- image: they will trigger a re-rendering and may cause a layout shift if the width and height attributes are not present or had bad values
- iframe: they will trigger another page load.
CSSOM Building
In this phase, the browser will transform all CSS (inline and stylesheet) into a CSSOM (tree)
Fully loaded
The page is loaded. Image may still download. The page is not yet fully rendered.
Metrics:
- Page Speed - Load time - The amount of time to complete all the processing and resource (images, styles, etc) loading for the page.
Event:
- load event: occurs on a element or on the page (ie window)
Rendering
Browser - Rendering ( HTML Latency)
- Render tree: Building the render tree from the DOM and CSSOM
- Box Model tree creation
Metrics:
Event:
- With the performance timeline observer, you can responds for instance to LCP.
- With the requestAnimationFrame callback, you can execute a script between rendering frames.
Metrics
Analytics Provider
Your web analytics provider should provide you with them.
Example for Google Analytics

Timing
Browser API
You can get the metrics via:
- or a library such as perfume
Example:
// All results are reported to the analyticsTracker callback
new Perfume({
  analyticsTracker: options => {
    const { metricName, data, eventProperties, navigatorInformation, vitalsScore, } = options;
    switch (metricName) {
       case 'fp':
           console.log('firstPaint duration: '+data);
           return;
       case 'fcp':
           console.log('firstContentfulPaint duration: '+data);
           return;
       case 'lcp':
           console.log('largestContentfulPaint duration: '+data);
           return;
       default:
          return;
    }
  },
});
Control / Solution
The below table lists the parameters that have an impact on the speed of your page load.
| Resources | Javascript | Css Stylsheet | Image / Video | TCP Network | Description |
|---|---|---|---|---|---|
| Preload | x | x | Load non-critical Javascript or CSS | ||
| Async/Defer | x | Loading in parallel | |||
| Lazy loading | x | Load only when the element is going into the viewport | |||
| Tree shaking/ pruning | x | x | Delete code that is not relevant | ||
| Minify | x | x | Compress the code | ||
| Responsive Image | x | Use and advertise the best image (size and format) | |||
| HTTP accept encoding | x | x | Compress the HTTP content (compress, gzip, …) | ||
| Edge/Cdn server | x | x | x | x | Serve the page and resources close to the user |
| HTTP cache / Bundle / Inline | x | x | x | x | Reduce the number of resource requests (Bundle or incorporate in your page) |
HTTP Resource Request Optimization
HTTP request for resources have a latency cost. You can see their effect in the devtool network tab.

In this case, even if the resources (css, js, img) were not modified and in the cache, the browser goes through a conditional cache validation request. And even if the server returns a 304 Not Modified status, the network round trips (and server response) add latency.
To eliminate this network requests, the solution are:
- to cache them without revalidation. (ie without any revalidate in cache-control (example without Cache-Control: proxy-revalidate))
- to bundle the script resources (javascript and css) into one file
- or to incorporate the resources in the page if they are tiny enough via the style (css) and script tag (javascript)
Server Location
On a world scale, the location of the server has a great impact on the response time.
In a single server architecture can you guess where the server is located ?

This takes into account only the first byte of the response (network performance), it may add up to seconds when the full page is loaded.
Solution: Edge/Cdn server
- static cdn: you put a cdn proxy cache solution in front of your web server (cloudflare, ..)
- dynamic cdn: you locate multiple web servers and redirect the browser request via DNS or Anycast solution
User Effect
Bounce by latency
Probability of bounce by page latency.

User perception
- 100 ms: user perceives as instantaneous
- 1s: is about the upper limit of human flow of though. User loses the feeling direct feedback
- 10s: Upper limit of attention. Feedback is important and the chance of context switch is high.
Record
To record a page load, you would use a headless browser
Utility
- side-by-side-pageload.js - Load 2 or more pages side-by-side to visually see the difference in page load. Optional desktop viewport and throttling settings.
- https://web.dev/vitals-tools-workflow/ - A performance-focused workflow based on Google tools
States
The Page lifecycle API 1) formalizes two new lifecycle states:
- Frozen: lifecycle state for CPU suspension. This means that the freeze steps algorithm was called
- Discarded: means that the discard algorithm was called
Documentation / Reference
- The timeline event reference - all events triggered while making a recording.