
Checking the output
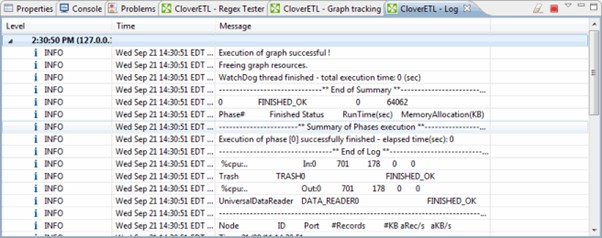
Using the Console and the Clover Log, you can check the details of graph execution.
Debugging
Debugging is a feature that lets you see what data was passed along any edge in a graph.
When debugging an Integrator graph, keep in mind that all components in the same phase run in parallel and are multi-threaded. Therefore, make sure you start with components that are flagged as errors (with a red exclamation point ) and not with warnings (with a yellow question mark ), even if the warnings appear to occur logically before the errors.
To debug a graph:
- Right-click the edge and select Enable Debug. The debug icon appears on the edge.
- Re-run the graph so that Integrator can generate the debug data.
- Right-click the edge and select View data. The View data window shows all of the data fields correctly parsed and loaded.