About
The performance load metrics in the context of a system. This CPU metrics is often called a CPU Load average but this is really a system load average as Unix refers it as the run-queue length. Ie:
- the sum of the number of processes that are currently running
- plus the number that are waiting (queued) to run.
CPU load can be compared with car traffic. “Cars” are processes:
- using a slice of CPU time (“crossing the bridge”)
- or queued up to use the CPU.
Amount meaning
Single Processor
For one core:
- 0.00 means there's no traffic. Between 0.00 and 1.00 means there's no wait an arriving process will just go right on.
- 1.00 means the CPU is exactly at capacity. All is still good, but if traffic gets a little heavier, things are going to slow down.
- over 1.00 means there's backup. How much? Well, 2.00 means that there is 2 CPU to process the whole traffic. – 1CPU working, and one CPU waiting..
To not wait, the CPU load should ideally stay below 1.00.
Rule of Thumb: 0.70 If your load average is staying above > 0.70, it's time to investigate before things get worse.
Multi-processor
On multi-processor system, the load is relative to the number of processor cores available. A load of 1.00 is 100% CPU utilization on single-core box. On a dual-core box, a load of 2.00 is 100% CPU utilization.
The total number of cores is what matters, regardless of how many physical processors those cores are spread across.
Example on Linux
grep 'model name' /proc/cpuinfo | wc -l
40
# The max load is then 40
CPU On linux (Uptime and top):
# uptime or top output
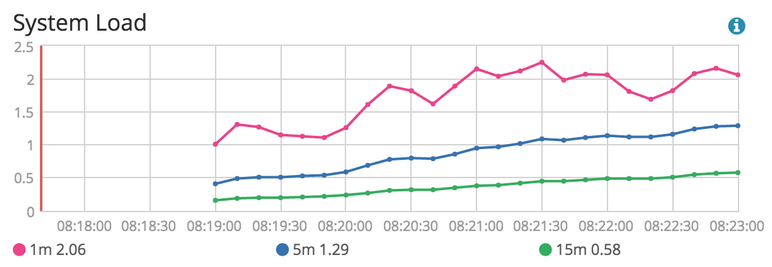
12:54:11 up 326 days, 10:56, 1 user, load average: 0.11, 0.08, 0.09
where
- 0.11 is the average over the last minute,
- 0.08 is the average over the last five minutes,
- and 0.09 is the average over the last 15 minutes
How to decrease the load
The most common technic to decrease the load of a server is to cache the response. 1) 2) 3) 4)