Time Series - Breakout detection
About
Breakout occurs in time series data and have two characteristics:
- A Mean shift: A sudden jump in the time series corresponds to a mean shift. A sudden jump in CPU utilization from 40% to 60% would exemplify a mean shift.
- A Ramp up: A gradual increase in the value of the metric from one steady state to another constitutes a ramp up. A gradual increase in CPU utilization from 40% to 60% would exemplify a ramp up.
Time series often contain more than one breakout.
Breakouts detection must be robust, from a statistical standpoint, in the presence of anomalies.
Utilization
Breakout detection can be used to detect
- change in user engagement (such as during popular live events such as the Oscars, Super Bowl and World Cup.)
- hardware issues (breakouts in time series data of system metrics)
- in user engagement post an A/B test
- …
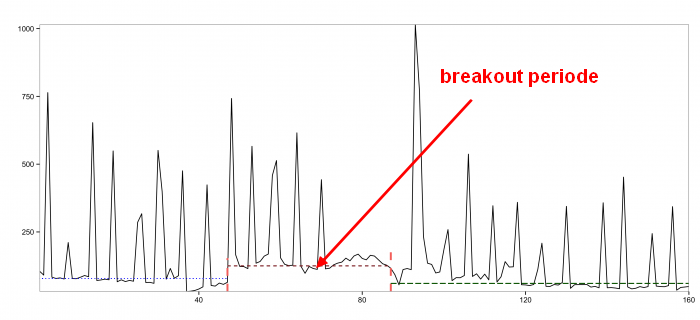
where:
- The two red vertical lines denote the locations of the breakouts detected
- we can see that the detection is robust to anomalies (the peaks)
Twitter R Package
The underlying algorithm of the R package– referred to as E-Divisive with Medians (EDM) – employs energy statistics to detect divergence in mean. Note that EDM can also be used detect change in distribution in a given time series.
See BreakoutDetection on Github
Documentation / Reference
- The Behavioral Change Point Analysis (BCPA) is a method of identifying hidden shifts in the underlying parameters of a time series.
