I/O - IOmeter (Workload Generator)
About
IOmeter is a disk-testing, IO workload generator tool which generate and measure storage performance.
Iometer is pronounced “eye-OM-i-ter,” to rhyme with “thermometer.” Iometer does for a computer’s I/O subsystem what a dynamometer does for an engine: it measures performance under a controlled load. Iometer was formerly known as “Intel's Galileo”.
It can be configured to emulate:
- disk
- or network I/O load
Architecture
Iometer consists of two programs:
- Iometer (the GUI administration tool)
- and Dynamo. (the multithreaded workload generator)
Iometer is both:
- a workload generator (that is, it performs I/O operations in order to stress the system)
- and a measurement tool (that is, it examines and records the performance of its I/O operations and their impact on the system).
If you want to run Dynamo on multiple machines, Dynamo.exe must be available on each machine (on either a local or networked disk).
Glossary
Manager
- Each running copy of Dynamo is called a manager;
Worker
- each thread within a copy of Dynamo is called a worker.
Intel recommends to create one worker per processor. They receives their I/O Access Pattern.
Measurement
It can measure not only the throughput, but provides a wealth of information about the system utilization and latency.
Iometer can be used for measurement and characterization of:
- Performance of disk and network controllers.
- Bandwidth and latency capabilities of buses.
- Network throughput to attached drives.
- Shared bus performance.
- System-level hard drive performance.
- System-level network performance.
Configuration
It can be configured to emulate the disk or network I/O load of any program or benchmark, or can be used to generate entirely synthetic I/O loads. It can generate and measure loads on single or multiple (networked) systems.
An access pattern contains mainly the following parameters:
- Transfer Request Size - a minimal data unit to which the test can apply.
- Percent Random/Sequential Distribution - percentage of random requests to set the access mode (random or sequential)
- Percent Read/Write Distribution - percentage of requests for reading.
Another important variable which is not directly included into the access pattern - # of Outstanding I/Os - defines a number of simultaneous I/O requests for the given worker and, correspondingly, disc load.
Disk
Icons:
- Blue icons represent physical drives; they are only shown if they have no partitions on them.
- Yellow icons represent logical (mounted) drives; they are only shown if they are writable.
- A yellow icon with a red slash through it means that the drive needs to be prepared before the test starts
Steps
Local
When iometer is started, it builds a file to use for IO
- Open iometer.exe (It will start one copy of Dynamo on the same machine)
Dynamo version 1.1.0, x86-64, built Mar 14 2014 23:07:56


Number of processors: 8
 Using performance counter frequency: 10MHz.
Number of processors: 8
 Using performance counter frequency: 10MHz.
Sending login request...
   NICO
    (port 61097)
Successful PortTCP::Connect
  - port name: nico

*** If dynamo and iometer hangs here, please make sure
*** you use a correct -m <manager_computer_name> that
*** can ping from iometer machine. use IP if need.
   Login accepted.
Windows NT version: 6.2
Reporting volume information...
Found: 4
Reporting raw disk information...
Physical disk '\\.\PHYSICALDRIVE0' contains partition information.
Use --flag FORCE_RAW option to display.
Failed opening device \\.\PHYSICALDRIVE1.
Found: 0
Reporting network share information...
Found: 0
Reporting TCP network information...
   done.
- Select a worker
- Select a disk for the worker
- Set the size (Each sector is 512 bytes, 16 GiB is 33554432 sectors)
- Select an access specification for the workers
- Select more worker and do it again if needed
- Set a ramp up time to 10 sec
- Start the workload with the green flag
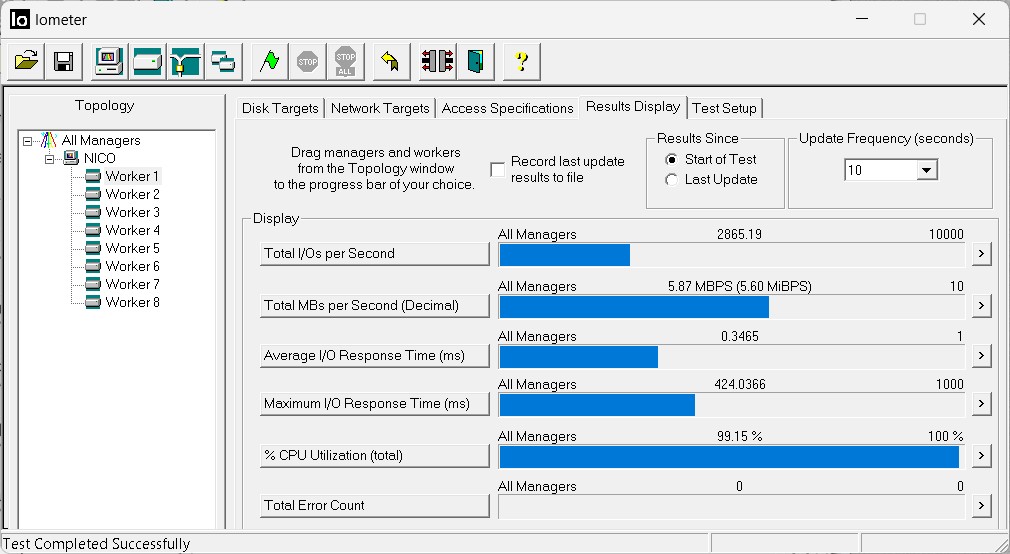
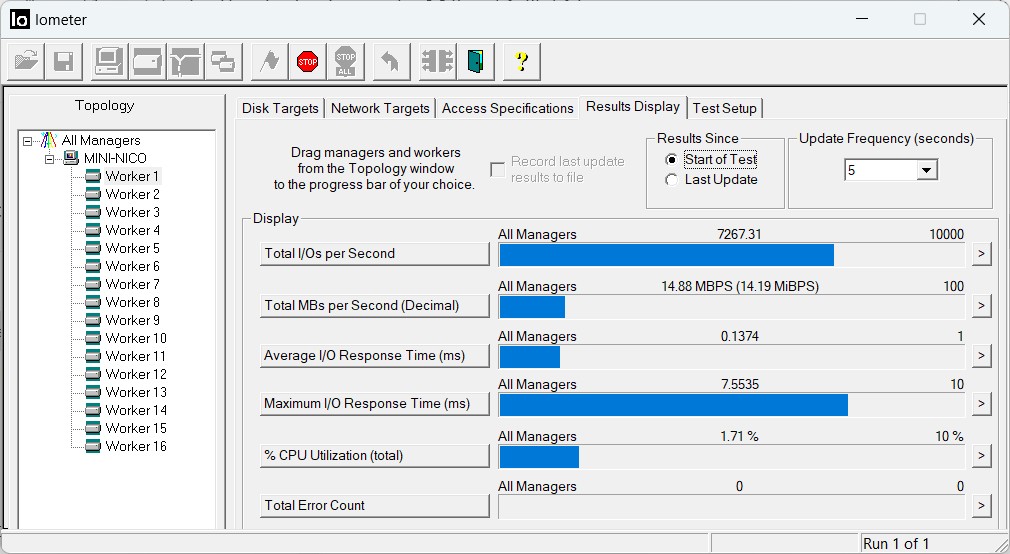
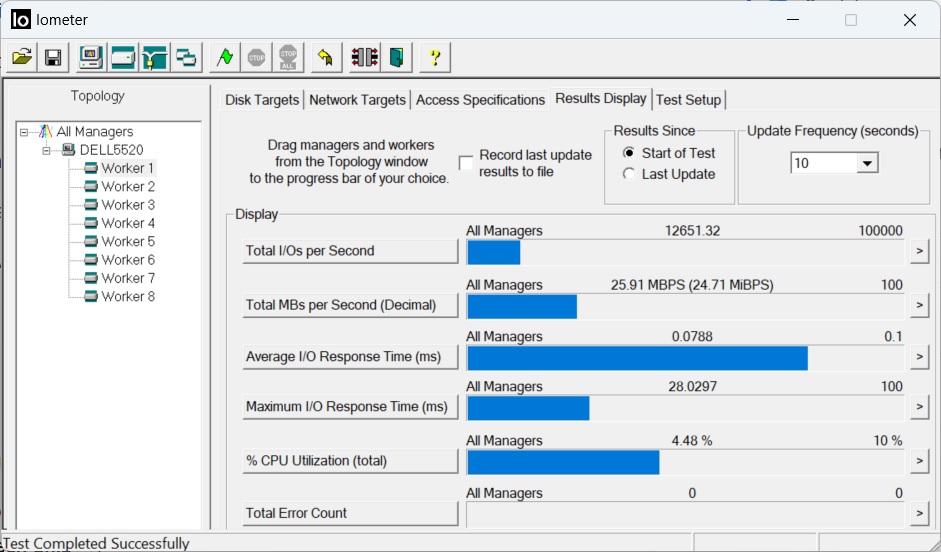
- Go to the Results Display tab
- Set the Update Frequency (seconds) to five to see live the results.
Example of results
- Old PC401 NVMe SK Hynix 1TB Generation 3 PCI/NVM
Network
On each machine, start dynamo by giving the name of the machine running Iometer
dynamo IOMeterHostNameMachine
Command Line
iometer /c bigtest.icf /r bigtest_results.csv
where:
- bigtest.icf is a IOMeter config file
- bigtest_results.csv is the result


