Business Method - Six Sigma
About
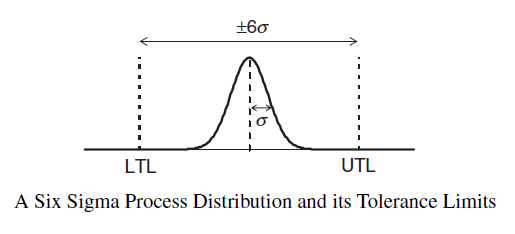
Six Sigma (6s) is an approach to improve the performance of business process.
where:
- UTL = Upper Tolerance Limit. See Viz - Control Chart (Shewhart)
- LTL = Lower Tolerance Limit
The 6s strategy was developed by Motorola, Inc. in the mid-1980s to help boost the quality level of its products. After Motorola became the first company to win the Malcolm Baldrige National Quality Award in 1988, the ensuing media exposure introduced the 6s approach to many other manufacturing companies, most notably Allied Signal (now Honeywell International) and General Electric. Today, with thousands of companies around the world adopting this philosophy, 6s is arguably the most popular process improvement strategy ever devised.
6s has done an admirable job of organizing statistical techniques with a solid strategy (DMAIC : Define–Measure–Analyze–Improve–Control) for applying them in a logical manner to efficiently enhance process performance. However, all this has been done before in various forms. One of the reasons 6s is still around today—and the others aren’t—is because 6s evolved from its original focus on quality improvement to concentrate on profit improvement.
Therefore, to achieve 6s quality levels on the shop floor, forward-thinking companies must start at the beginning, with the design of the product and the process that will produce it. Improving a product in the design phase is almost always much easier (and much cheaper) than attempting to make improvements after it is in production. By preventing future problems, DFSS is definitely a much more proactive approach than the DMAIC strategy, which is mainly used to fix existing problems.
Articles Related
Statistical Tools for Six Sigma and DFSS
| Number | Name | Purpose |
|---|---|---|
| 1 | Run chart | Visualize a process over time |
| 2 | Scatter plot | Visualize relationships between two or more variables |
| 3 | IX, MR Control Chart | Test a process for stability over time |
| 4 | Dot graph | Visualize distributions of one or more samples |
| 5 | Boxplot | Visualize distributions of one or more samples |
| 6 | Histogram | Visualize distribution of a sample |
| 7 | Stem-and-Leaf | Displays Visualize distribution of a sample |
| 8 | Isogram | Visualize paired data |
| 9 | Tukey mean - difference plot | Visualize paired data |
| 10 | Multi-vari plot | Visualize relationships between one Y and many X variables |
| 11 | Laws of probability | Calculate probability of events; Background for most statistical tools |
| 12 | Hypergeometric distribution | Calculate probability of counts of defective units in a sample selected from a finite population |
| 13 | Binomial distribution | Calculate probability of counts of defective units in a sample with a constant probability of defects |
| 14 | Poisson distribution | Calculate probability of counts of defects or events in a sample from a continuous medium |
| 15 | Normal distribution | Calculate probability of characteristics in certain ranges of values |
| 16 | Sample mean with confidence interval | Estimate location of a population based on a sample |
| 17 | Sample standard deviation with interval | Estimate variation of a population based on a sample confidence |
| 18 | Rational subgrouping | Collect data to estimate both short-term and long-term process behavior, Plan statistical process control |
| 19 | Control charts for variables: X,s and X, R | Test a process for stability over time |
| 20 | Statistical tolerance intervals | Calculate limits which contain a percentage of a population values with high probability |
| 21 | Exponential distribution | Estimate reliability of systems, estimate times between independent events |
| 22 | Weibull distribution | Estimate reliability of systems |
| 23 | Failure rate estimation with confidence interval | Estimate reliability of systems |
| 24 | Binomial proportion estimation with confidence interval | Estimate probability of counts of defective units in samples with a constant probability of defects |
| 25 | Control charts for attributes: np, p, c and u | Test a process producing count data for stability over time |
| 26 | Poisson rate estimation with confidence interval | Estimate rates of defects or events in space or time |
| 27 | Variable Gage R&R study | Assess precision of variable measurement systems |
| 28 | Attribute agreement study | Assess agreement of attribute measurement systems to each other |
| 29 | Attribute gage study | Assess accuracy and precision of attribute measurement systems |
| 30 | Control chart interpretation | Test processes for stability over time, Identify possible causes of instability |
| 31 | Measures of potential capability (CP and PP) with confidence intervals | Estimate potential capability of a process to produce non-defective , products, if the process were centered |
| 32 | Measures of actual capability (CPK and PPK), with confidence intervals | Estimate actual capability of a process to produce non-defective products |
To continue p18 of 59 tools for Six Sigma