Statistics - (Normal|Gaussian) Distribution - Bell Curve

Thomas Bayes

About

A normal distribution is one of underlying assumptions of a lot of statistical procedures.

In nature, every outcome that depends on the sum of many independent events will approximate the Gaussian distribution after some time, if respected the assumptions of the Central limit theorem.

Data from physical processes typically produce a normal distribution curve.

Because of the Central limit theorem, the normal distribution plays a fundamental role in probability theory and statistics.

The normal distribution is commonly denoted as <math>N(0,1)</math> .

Properties

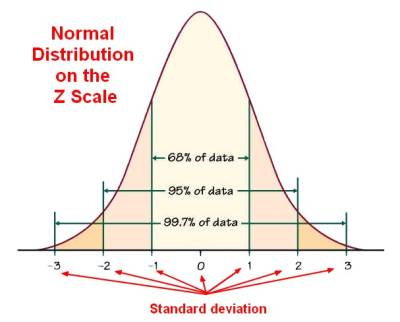
Normal Distribution Z Scale

The properties of a normal distribution are well-known:

See density for the function

Explication

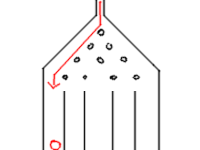
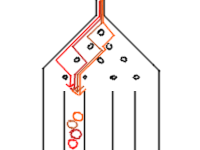
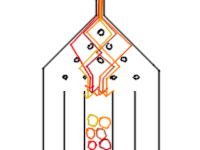
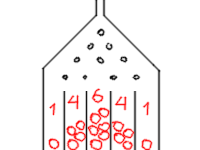
Considering the classic bean machine (Galtonboard, Galtonbrett Simulation, quincunx or Galton).

The Galtonboard is a device invented by Sir Francis Galton to demonstrate the central limit theorem, in particular that the normal distribution is a good approximate to the binomial distribution.

Gaussian Column First There's only one way for a ball to reach the first column
Gaussian Column Second There are four ways to reach the second column
Gaussian Column Third There are six ways to reach the third column
Gaussian Total Because the machine is symetrical, after some time it will look like a gaussian distribution

Function

Density

The Gaussian function (density) has the form:

<MATH> f(x) = \frac{1}{\sigma\sqrt{2\pi}} e^{\displaystyle -\frac{1}{2} \left (\frac{x-\mu}{\sigma} \right )^2} </MATH>

where:

Pdf Normal Distribution

As notated on the figure, the probabilities of intervals of values correspond to the area under the curve.

Cumulative

The cumulative distribution function (CDF) is noted <math>\Phi(z)</math> .

Normal Distribution Cdf

where:

Approximation

Trigonometry - (Cosine|Cosinus) <MATH> f(x) = \frac{1+cos(x)}{2\pi} </MATH> This approximation can be integrated in closed form

Documentation / Reference


Discover More
Card Puncher Data Processing
(Mathematics|Statistics) - Statistical Parameter

population parameter A parameter is a numerical characteristic, feature, or measurable factor that help in defining a particular model. Unlike variables, parameters are not listed among the arguments...
Binomial Distribution
(Probability|Statistics) - Binomial Distribution

The binomial distribution is the discrete probability distribution of the number of successes in a sequence of n independent yes/no experiments, each of which yields success with probability p. The...
Six Sigma
Business Method - Six Sigma

Six Sigma (6s) is an approach to improve the performance of business process. where: sigma UTL = Upper Tolerance Limit. See LTL = Lower Tolerance Limit The 6s strategy was developed by Motorola,...
Card Puncher Data Processing
Computer Monitoring / Operational Intelligence / Real Time Monitoring

Monitoring is the process of defining metrics and alerts in order to respond to a performance degradation where the acceptable level was defined in service level agreement. Monitoring system implements...
Thomas Bayes
Data Mining - Outliers Cases

Outliers are cases that are unusual because they fall outside the distribution that is considered normal for the data. The distance from the centre of a normal distribution indicates how typical a given...
Logit Vs Probit
Data Mining - Probit Regression (probability on binary problem)

Probit_modelprobit model (probability + unit) is a type of regression where the dependent variable can only take two values. As the Probit function is really similar to the logit function, the probit...
Utah Teapot
Data Visualisation - Histogram (Frequency distribution)

A histogram is a type of graph generally used to visualize a distribution An histogram is also known as a frequency distribution. Histograms can reveal information not captured by summary statistics...
Data System Architecture
Distribution - Measures of (center|central tendency) (Mean, Median, Mode)

A Measure of central tendency is a measure that describes the middle or center point of a distribution. A good measure of central tendency is representative of the distribution. The mean, the median and...
Gaussian Column First
Galton board

The is a physical model of the binomial distribution which beautifully illustrates the central limit theorem Galtonboard is also known as: Galtonbrett Simulation, quincunx bean machine or...
Random Generator
Number - Random (Stochastic|Independent) or (Balanced)

Think of randomness as a lack of pattern. Something random should be unpredictable. We shouldn’t be able to predict the next value of the sequence The degree to which a system has no pattern is known...


Share this page:
Follow us:
Task Runner