
About
A moderation analysis is a multiple regression analysis.
The main reason to run a moderation analysis is to demonstrate how a third variable (Z) changes the correlation between two variables (X and Y).
We have a correlation between x and y, and then it varied as a function of z.
A moderator is a variable that will try to say if the outcome variable is influenced by each value of a variable or not. If it's the case, it will enhance the model.
A moderator variable (Z) will enhance a regression model if the relationship between X and Y varies as a function of Z
The moderator has influence over other effects, over others relationships. A mediator is designed to explain a relationship (for instance between a predictor and an outcome)
If there is a moderator, Z, then the regression coefficient (B) will NOT be representative across all Z. The relationship between X and Y is different at different (levels|value) of Z.
In moderation analysis, X and Y are correlated, but if a Z variable (the moderator variable) is thrown in with the product term, X and Y aren't correlated any-more for all values of Z.
In moderation, the predictors are correlated.
Articles Related
Research
Experimental
- The manipulation of an independent variable (X) causes change in a dependent variable (Y)
- A moderator variable (Z) implies that the effect of the independent variable on the dependent variable (X on Y) is NOT consistent across the distribution of Z
Correlational
- Assume a correlation between X and Y
- A moderator variable (Z) implies that the correlation between X and Y is NOT consistent across the distribution of Z
Model
X and Z are continuous
If both X and Z are continuous:
<math> Y = B_0 + B_1X + B_2Z + B_3(X*Z) + e </math>
where:
- <math> B_0 </math> is the regression constant
- <math> B_n </math> are the regression coefficient
- <math> e </math> is the residual
- <math> Y </math> is the outcome variable
- <math> X </math> is the predictor variable
- <math> Z </math> is the moderator variable
Adding the product of X and Z permit to trick the GLM in order to test no linear effect. As it is a product, it's testing a non-additive effect. If the product is significant, that's suggest that we have a moderation effect.
X is categorical and Z is continuous
If X is categorical (with 3 levels) and Z is continuous:
<math> Y = \underbrace{B_0 + B_1D_1 + B_2D_2 + B_3Z}_{\displaystyle \text{Main Effect}} + \underbrace{B_4(D_1*Z) + B_5(D_2*Z)}_{\displaystyle \text{Moderation Effect Testing}} + e </math>
where:
- <math> B_0 </math> is the regression constant
- <math> B_n </math> are the regression coefficient
- <math> e </math> is the residual
- <math> Y </math> is the outcome variable
- <math> D_n </math> are the dummy coding of X. Because X is categorical, we have to introduce dummy coding
- <math> Z </math> is the moderator variable
Because we have 3 levels of X, we need two products in order to represent moderations.
How to
test for moderation
Evidence for a “significant” moderation effect can be detected by:
- The p-value & t-test for the product term (mod)
- The p-value & F-test (anova) comparing a model with a moderator to a model without the moderator
If both X and Z are continuous
- Model 1: No moderation
- Model 2: Moderation
- Test:
- In the case of only two variables, if the coefficient of the moderator is significant, you have a moderation effect.
- Compare Model 1 and Model 2
If X is categorical* and Z is continuous
- Model 1: No moderation
- Model 2: Moderation
- Test:
- We can't look at one regression coefficient because there's actually more than one that carry the moderation effect. So we have to do a model comparison
Model comparison
When we're looking at a moderation regression analysis, we're looking at the predicted difference in slopes, not at the predicted difference in means. If there's a significant difference in the slope for one of the nominal value of a variable, that is an evidence of moderation.
Models
Comparison of models is done in terms of the overall variance explained in the outcome. R square.
An NHST in R (anova) does that in order to make the statement that there's a statistically significant change in the overall variance explained when adding in the moderator. I the p value is < 0.05, there's a significant difference in the amount of variance that the two models explain.
Coefficient
Evaluate the regression coefficient (B) values for predictors associated with the moderation effect
- (X*Z)
- (D1*Z) and (D2*Z)
Centering predictors
Centering predictors make interpreting the results of a moderation analysis, much simpler. Centering is essential when doing a moderation analysis.
Centering predictors means take your predictor variable and put it into deviation form. That is just create deviation scores, instead of the raw scores.
The deviation form gives us an average for a single predictor, x that's equal to zero.
Visualisation
If we have moderation then the correlations change as a function of the nominal variable.
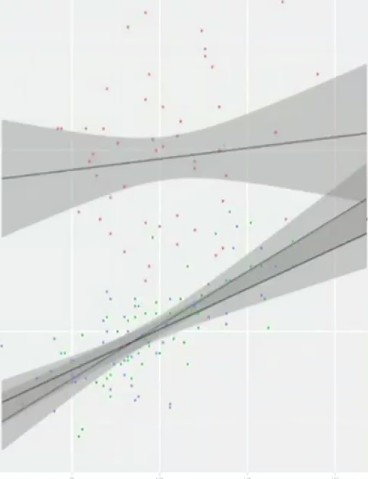
2D
By plotting one scatter-plots by nominal value, we can see this correlations through the regression line.
The fact that the regression lines are not parallel, is evidence that you have moderation. If they're parallel, that indicates that you don't have moderation. Because that indicates that the effect is consistent across all nominal values. When it's inconsistent across the nominal values, that's moderation.
3D
| Uncentered, Additive | Centered, Additive |
|---|---|
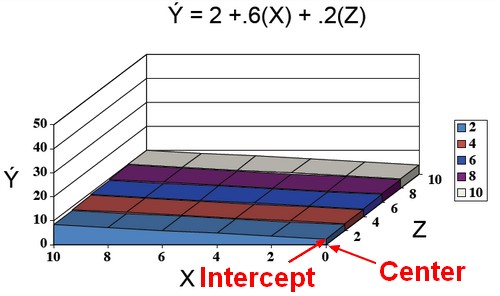 | 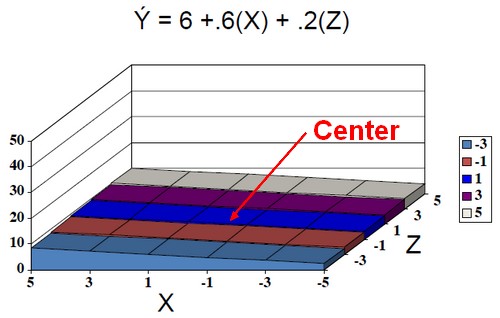 |
| Uncentered, Moderation | Centered, Moderation |
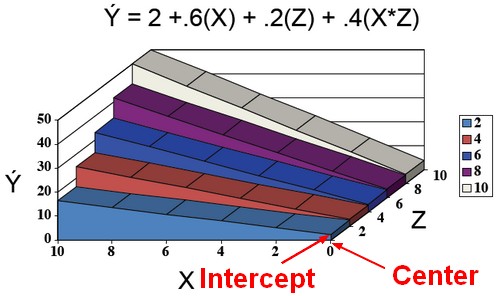 | 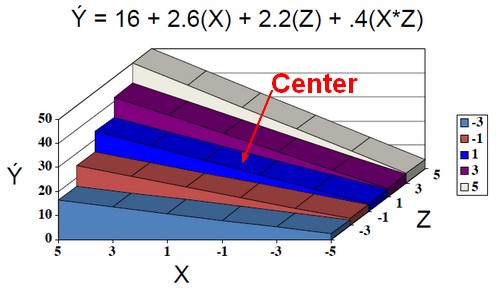 |
Within the moderation effect, notice that after centering, only the slope of the higher order term that is, the product term (XZ) did not change, the others did.
This slope won't change because that's what's most critical in the regression tellnig you that you have a moderation effect.
The lower order terms (the slope who changes) aren't reliable across all values of the other variables because they change.
The nice thing about centering is that when I center it's giving the slope relating X to Y at an average level of Z.