About
The Area Under Curve (AUC) metric measures the performance of a binary classification.
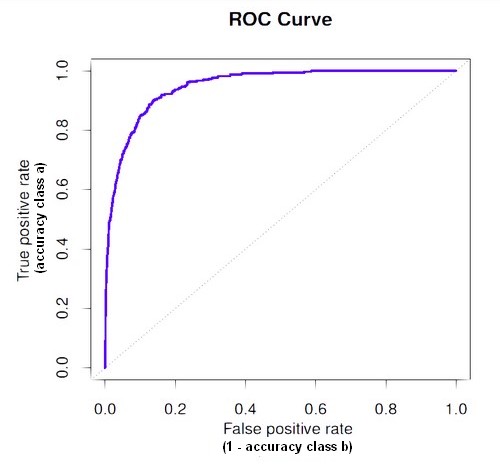
In a regression classification for a two-class problem using a probability algorithm, you will capture the probability threshold changes in an ROC curve.
Normally the threshold for two class is 0.5. Above this threshold, the algorithm classifies in one class and below in the other class.
You may want to move this threshold. False positives (legitimate emails erroneously predicted as spam) are likely to cause more harm than false negatives (spam emails that are not identified as spam), as we might miss an important email, while it is easy to delete a spam message. In this case, we could require a higher threshold (probability) that a message is spam before we move it into a spam folder.
ROC means Receiver Operating Characteristic. It's an historical term from WW2 that was used to measure the accuracy of radar operators.
This is a single curve that captures the behaviour of the classification rate when varying the classification threshold.
Articles Related
Problem description
The goal is to have:
- the false positive rate to be low
- and the true positive rate to be high.
Curve
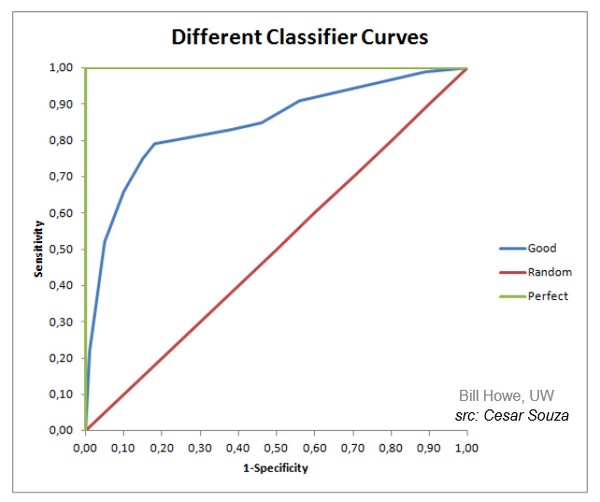
With a true positive rate of one and a false positive rate of zero, the best curve will right up as far as possible into the top left hand corner.
The 45 degree line is the kind of no information line (ie random See ROC curve with sensitivity).
False positive / True positive
Sensitivity / Specificity
See Sensitivity and Specificity
Metrics
Area under the curve (AUC)
Tools
Weka
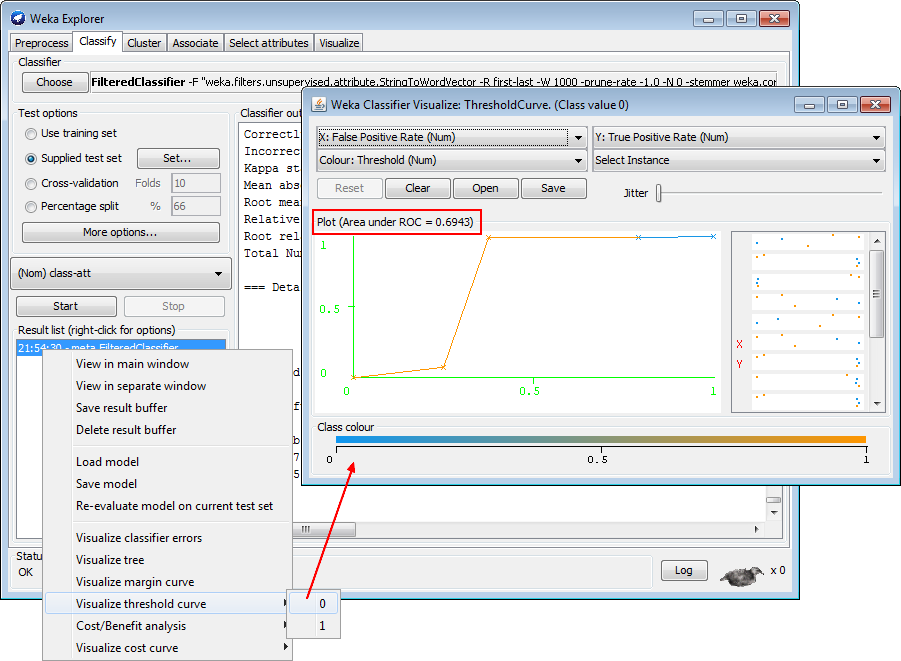
A ROC curve for a J48 algorithm.


