BIP 10G - (Chart|Graph)
About
BI Publisher leverages the graph capabilities of Oracle Business Intelligence Beans (BI Beans graph DTD).
Articles Related
Xml Chart
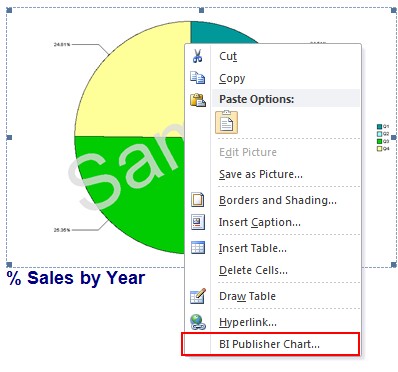
To see the Xml chart Definition, right-click the image to open the Format Picture palette and select:
- the Web tab. Office 2007
- the Alt Tab. Windows 2010
The DTD which defines the XML structure and elements is this one: graph.dtd - DTD (Document Type Definition) for Customizing Graphs in Oracle Reports - September 2003
In the stylePath attribute, you can find the XML Styles. They defined a lot of standard default style attributes.
chart:
<Graph stylePath="/oracle/dss/graph/styles/april.xml" depthAngle="50" depthRadius="8" pieDepth="30" pieTilt="20" seriesEffect="SE_AUTO_GRADIENT"><LegendArea visible="true" />
	<Title text="My Title" visible="true" horizontalAlignment="CENTER" />
	<LocalGridData colCount="{count(xdoxslt:group(current-group(),  'LAST_NAME'))}" rowCount="1">
		<RowLabels>
			<Label>SALARY</Label>
		</RowLabels>
		<ColLabels>
			<xsl:for-each-group select="current-group()" group-by="LAST_NAME" xmlns:xsl="http://www.w3.org/1999/XSL/Transform">
				<xsl:sort select="current-group()/LAST_NAME" />
				<Label>
					<xsl:value-of select="current-group()/LAST_NAME" />
				</Label>
			</xsl:for-each-group>
		</ColLabels>
		<DataValues>
			<RowData>
				<xsl:for-each-group select="current-group()" group-by="LAST_NAME" xmlns:xsl="http://www.w3.org/1999/XSL/Transform">
					<xsl:sort select="current-group()/LAST_NAME" />
					<Cell>
						<xsl:value-of select="sum(current-group()/SALARY)" />
					</Cell>
				</xsl:for-each-group>
			</RowData>
		</DataValues>
	</LocalGridData>
</Graph>
Xml Element
autoLayout
Graph has an attribute called “autoLayout”. By default the value of this attribute is set to “AL_ALWAYS”, which means that the Title / Label placement (attributes like “wordWrapEnabled”, “tickLabelStaggered”, “textRotation”) are controlled by the graphing engine.
- AL_ALWAYS: the graphing engine control the graph layout completely and set the attributes
- AL_NEVER: the attributes are set manually
- AL_AS_NEEDED: graphing engine will take a call on whether to use your attributes or its own default settings
Scale
To define a fix scale on the Y axis for instance from 1 to 5 with a pad of 1 without decimal, add the following element in the graph element.
<Y1Axis visible="true" axisMinAutoScaled="false" axisMinValue="1" axisMaxAutoScaled="false" axisMaxValue="5"
majorTickStepAutomatic="false" majorTickStep="1">
      <ViewFormat decimalDigitUsed="true" decimalDigit="0" />
</Y1Axis>
Font and size
chart:
<Graph depthAngle="50" depthRadius="8" pieDepth="30" pieTilt="20" seriesEffect="SE_AUTO_GRADIENT">
        <LegendArea visible="true" />
	<LegendText>
		<GraphFont name="Arial" size="10" bold="false" italic="false" underline="false" />
	</LegendText>
	<Y1TickLabel>
		<GraphFont name="Arial" size="10" bold="false" italic="false" underline="false" />
	</Y1TickLabel>
	<O1TickLabel>
		<GraphFont name="Arial" size="10" bold="false" italic="false" underline="false" />
	</O1TickLabel>
        ..............
</Graph>
Styles
The standard styles are packaged in bipres.jar under /oracle/dss/graph/styles/
$ find / -name bipres.jar
/OracleBI/oc4j_bi/j2ee/home/applications/xmlpserver/xmlpserver/WEB-INF/lib/bipres.jar
/OracleBI/web/javahost/lib/sawrpccalls/xmlp5.6.1/bipres.jar
2D or 3D
The attribute depthRadius control the 2D, 3D property. It's the apparent depth in 3-D effect bar, line, or area graph; 0 is flat, 100 maximum depth
To obtain a 2D graph, you must set it to 0 such as:
chart:
<Graph stylePath="/oracle/dss/graph/styles/regatta_simple.xml" depthRadius="0" ....
Plot Area
The plot area is the place where the graph represents data values.
<PlotArea borderColor="#cccccc" borderTransparent="false" fillColor="#ffffff" fillTransparent="false">
    <Rect height="25600" width="19200"/>
</PlotArea>
The rectangle element defines the size and location of the object in virtual coordinates. The virtual-coordinate system keeps components in proportion to the graph when the graph changes size.
In the virtual-coordinate system, the center of the graph is 0,0. The upper left corner is -16000, +16000. The lower right corner is +16000, -16000. A component that is the full size of the graph has a width of 32000 and a height of 32000.
Definition
Chart is inside group
insert charts within groups to display the data for each grouping. For example: Your report contains sales data. Your template groups the data by year than by month to report the month's sales by industry. To insert a chart to display each month's data, simply insert the chart within the grouping tags and select the Chart is inside group box.
Support
My chart doesn't refresh
Verify that your chart is recognize in Word as a BIP Chart. You must see the BI Publisher Chart Menu option with a right click.
If not, you may have an incompatibility problem of Word version. Just generate a layout from the layout node in the rapport definition and use it to design your report.