About
How to make histogram in R.
typical plots with vertical bars are not histograms. See barplot or plot(*, type = “h”) for such bar plots
Articles Related
Package
Graphics
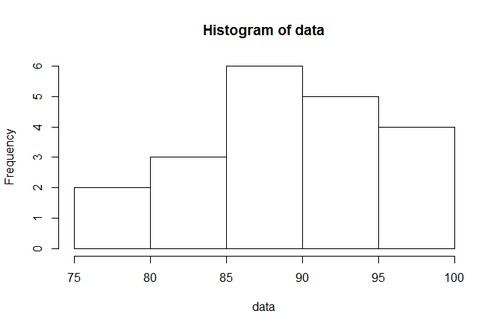
data = c(78 ,79 ,84 ,85 ,85 ,86 ,87 ,89 ,89 ,90 ,90 ,92 ,92 ,93 ,95 ,95 ,96 ,97 ,97 ,98)
hist(data)
You can use the layout function in order to have more than one histogram by page.
Example:
# 4 histograms in a 2x2 matrix
layout(matrix(c(1,2,3,4), 2, 2, byrow = TRUE))
Ggplot
See Ggplot - Histogram (geom_histogram, geom_freqpoly): Histogram:
- Geom: bar
- Stat: bin
- Scale: linear
- Coordinate system: Cartesian