
About
Monitoring tool for Weblogic and Java Component
You can view the metrics using the Oracle WebLogic Server Administration Console.
Articles Related
Tools
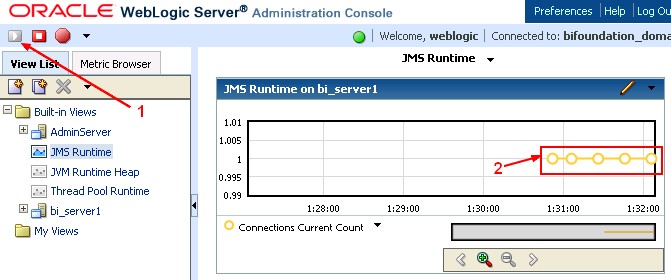
Monitoring Dashboard
The Monitoring Dashboard provides views and tools for graphically presenting diagnostic data about servers and applications running on them. The underlying functionality for generating, retrieving, and persisting diagnostic data is provided by by the WebLogic Diagnostics Framework.
You have two way to access the Monitoring Dashboard:
- From the Home Page of the Administration Console > Monitoring Dashboard under the Chart and Graph Section
- Or directly with this url: http://localhost:7001/console/dashboard
The Monitoring Dashboard displays metrics from two sources:
- Real-time, polled metric values that are obtained at regular intervals from running WebLogic Server instances and returned to the Monitoring Dashboard. When a view is started with charts that contain one or more real-time, polled metrics, the runtime MBean instances corresponding to those metrics are polled at each configured interval, and the requested metric values are returned to the Monitoring Dashboard.
- Metrics collected by the Harvester and placed into an Archive. To be able to view collected metrics, you must first configure the Harvester to collect the data you want to monitor and have it available in the Archive.
Collected metrics data is also available for programmatic access, and it is written to a standard log, HarvestedDataArchive, which you can view using the standard Administration Console as well as the Monitoring Dashboard.
Monitoring Metrics
Domain
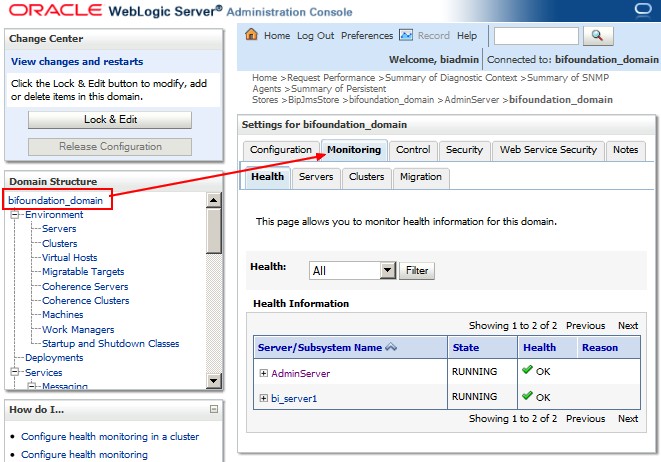
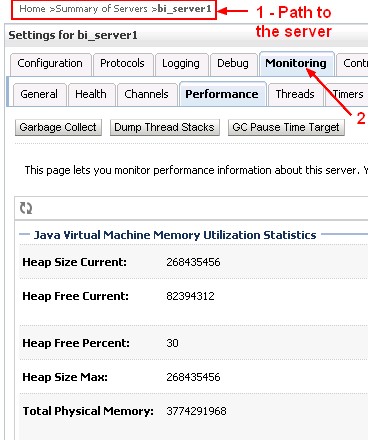
Server
Administration Server and Managed Server
Collect Metric Information
You can use WSLT commands to periodically save metric information to a file so that you have a record of past metric values.
See:
- and the MBean in Java.lang
In WSLT :
connect()
domainCustom()
cd ("java.lang")
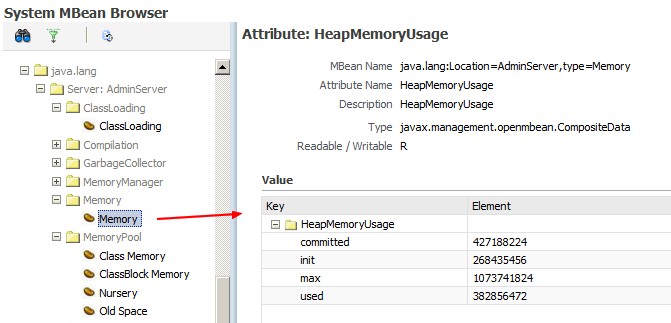
# Admin Server
cd ("java.lang:Location=AdminServer,type=Memory")
huAdmin = get("HeapMemoryUsage")
huAdmin.get("max")
1073741824L