OWB - Graphical mapping debugger
About
Step by step guide on how to use the OWB Graphical mapping debugger. You will find it in the mapping Editor.
The important steps consists to :
- define the test data
- and to run one step at a time the mapping
Steps
Start Debug
Start the debug session by clicking :
- Debug Start (
 ) on the toolbar.
 - or in the menu : Debug > Start
- or Ctrl + S on the keyboard
The Mapping Editor switches to debug mode with the debug panels appearing at the bottom of the editor.
Defining the Test Data
The debugger tries to locate objects in the target schema based on the names of the operators.

You can continue if :
- you have already created and filled the source table
- your original tables don't contain more than 5000 rows,
Otherwise, you will have an error message : see the support section on how to find a solution.
Test data tab
If you receive an error message, you can manage the test data in the test data tab from the debug panel.
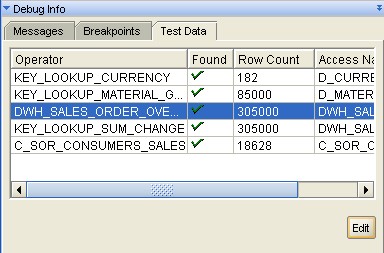
Every source or target operator in the mapping is listed on the Test Data tab in the Debug Info panel. It contains the object name and a check mark that indicates that the database object has already been bound to the source or target operator. Before you can run the mapping in debug mode, each listed source or target operator must be bound and have a check mark. Typically, you need test data for all source operators.
Bind Debug Test Data page
Clicking the Edit button launches the Bind Debug Test Data page, which enables you to add or change the binding of an operator, as well as the test data in the bound database objects.

Successful Debug initialization
After you have defined the test data connections for each of the data operators, you can initially generate the debug code by selecting Re-initialize from the Debug menu, or by clicking the Re-initialize button on the toolbar.
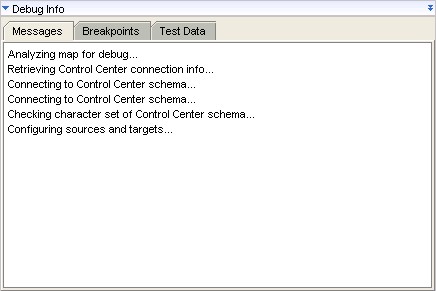
In the Messages tab, in the Debug Info panel, the Successful Debug initialization indicates that test data is available for all operators.

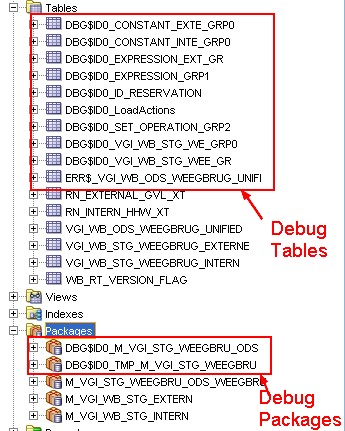
You can then see in the oracle schema location of the target module, the debug tables and packages which begin with the DBG letters that the debugger create for debugging purpose.
Breakpoint
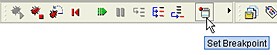
If you are interested in how a specific operator is processing data, you can set a breakpoint on that operator. Set breakpoint from the debug toolbar. This will cause a break in the debug session.
Notice that the Breakpoints tab appears in the Debug Info panel in the lower-left corner of the Mapping Editor. Breakpoints can be set during the mapping debug run and can be activated and deactivated as the mapping runs.
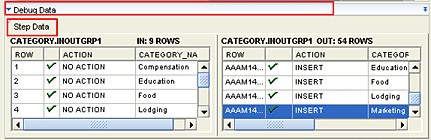
Step by Step
Using the Step icon on the toolbar, to step through the mapping and watch data flow into the selected object.
Click the Step button several times to retrieve rows for the debug run. Observe the rows of data in the Step Data tab in the Debug Data panel at the bottom right of the Mapping Editor.
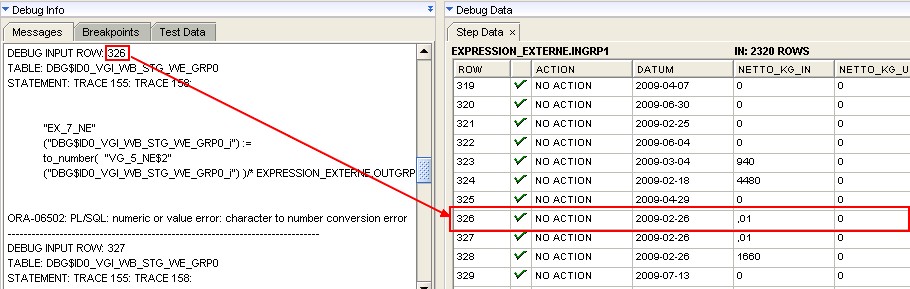
Error Message
If an error message appears, you can easily identify the original source data row :
Support
Could not find test data
When you run the mapping in debug mode for the first time Warehouse Builder will not be able to identify links to all source tables and gives the following error message:
Create the object and bind the operator.
More than 5000 rows
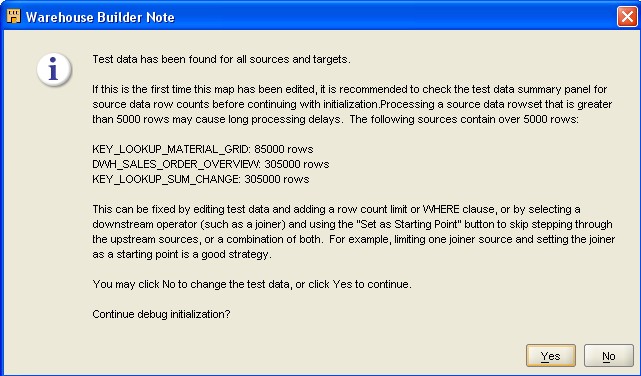
Use the bind_debug_test_data_page to limit the number of rows with the rows count check box for instance.