Thread work time breakdown:
: percent
: percent
: percent
If a transformation takes a small amount of time, the session log does not include it. If a thread does not have accurate statistics, because the session ran for a short period of time, the session log reports that the statistics are not accurate. |
Identifying Bottlenecks
The thread with the highest busy percentage identifies the bottleneck in the session.You can ignore high busy percentages when the total run time is short, such as under 60 seconds. - If the reader or writer thread is 100% busy, consider using string datatypes in the source or target ports. Non-string ports require more processing.
- If a transformation thread is 100% busy, consider adding a partition point in the segment. When you add partition points to the mapping, the Integration Service increases the number of transformation threads it uses for the session. However, if the machine is already running at or near full capacity, do not add more threads.
- If one transformation requires more processing time than the others, consider adding a pass-through partition point to the transformation.
| Measure | writer | transformation | reader |
|---|---|---|---|
| Max Time | Target Bottleneck | Transformation Bottleneck | Reader Bottleneck |
- Analyze performance counters. High errorrows and rowsinlookupcache counters indicate a mapping bottleneck.
- Add a Filter transformation before each target definition. Set the filter condition to false so that no data is loaded into the target tables. If the time it takes to run the new session is the same as the original session, you have a mapping bottleneck.
Session bottleneck
- If you do not have a source, target, or mapping bottleneck, you may have a session bottleneck. Small cache size, low buffer memory, and small commit intervals can cause session bottlenecks.
- To identify a session bottleneck, analyze the performance details. Performance details display information about each transformation, such as the number of input rows, output rows, and error rows.
System Bottlenecks
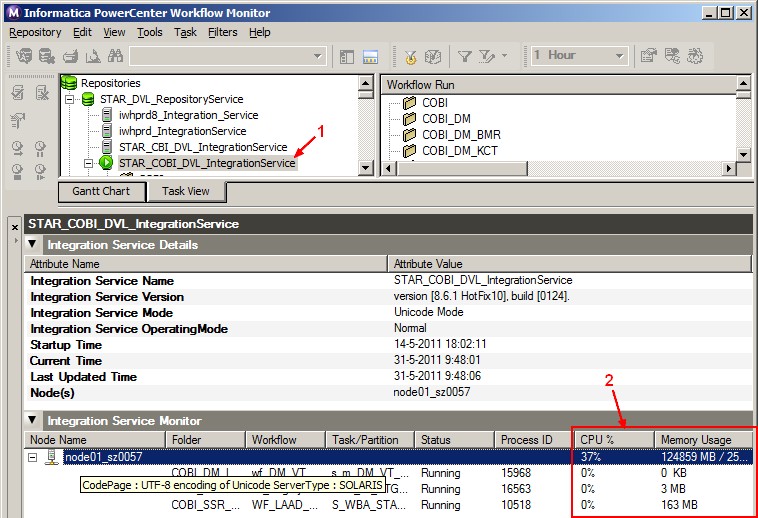
You can view system resource usage in the Workflow Monitor. You can use system tools to monitor Windows and UNIX systems.You can view the Integration Service properties in the Workflow Monitor to see CPU, memory, and swap usage of the system when you are running task processes on the Integration Service. Use the following Integration Service properties to identify performance issues:- CPU%. The percentage of CPU usage includes other external tasks running on the system.
- Memory usage. The percentage of memory usage includes other external tasks running on the system. If the memory usage is close to 95%, check if the tasks running on the system are using the amount indicated in the Workflow Monitor or if there is a memory leak. To troubleshoot, use system tools to check the memory usage before and after running the session and then compare the results to the memory usage while running the session.
- Swap usage. Swap usage is a result of paging due to possible memory leaks or a high number of concurrent tasks.
Partition
If you tune all the bottlenecks, you can further optimize session performance by increasing the number of pipeline partitions in the session. Adding partitions can improve performance by utilizing more of the system hardware while processing the session.Bottlenecks
Target
Small checkpoint intervals, small database network packet sizes, or problems during heavy loading operations can cause target bottlenecks.Source
Inefficient query or small database network packet sizes can cause source bottlenecks. You can create a read test mapping to identify source bottlenecks. A read test mapping isolates the read query by removing the transformation in the mapping and connect the source qualifiers to a file target.Possible resolutions:- Set the number of bytes the Integration Service reads per line if the Integration Service reads from a flat file source.
- optimize the query.
- Increase the database network packet size.
Mapping
To eliminate mapping bottlenecks, optimize transformation settings in mappings.Monitor
Integration Service
In the Workflow Monitor by selecting an Integration Service, you get the Integration Service Monitor where you can see per running task processes:- CPU%. The percentage of CPU usage includes other external tasks running on the system.
- Memory usage. The percentage of memory usage includes other external tasks running on the system. If the memory usage is close to 95%, check if the tasks running on the system are using the amount indicated in the Workflow Monitor or if there is a memory leak. To troubleshoot, use system tools to check the memory usage before and after running the session and then compare the results to the memory usage while running the session.
Articles Related